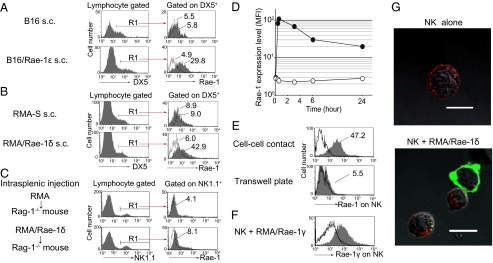
Fig. 3.

Rae-1 is transferred from RMA/Rae-1 to NK cells via trogocytosis. (A and B) B16 (5 × 10⁵), B16/Rae-1ε (2 × 10⁶) (A), RMA-S (5 × 10⁵), or RMA/Rae-1δ (1 × 10⁶) (B) were s.c. inoculated into C57BL/6 mice. Two weeks later, tumor-infiltrating lymphocytes were prepared, and Rae-1 expression on DX5+ NK cells was analyzed. Gray and dotted line histograms indicate anti–Rae-1 mAb and isotype control mAb staining, respectively. Numbers indicate the mean fluorescence intensity (MFI). (C) RMA or RMA/Rae-1δ (1 × 10⁷) was injected into spleen of Rag-1−/− mice. After 2 h, Rae-1 expression on NK1.1+ splenocytes was analyzed as described in B. (D) CFSE-labeled NK cells were cocultured with RMA/Rae-1δ at a 1:1 ratio for different periods of time (10 min, 30 min, 3 h, 6 h, and 24 h). The MFI of anti–Rae-1 mAb staining (closed circles) or isotype control mAb staining (open circles) of CFSE+ NK cells is shown. (E) CFSE-labeled NK cells were cocultured with RMA/Rae-1δ for 2 h together (cell–cell contact) or separated by a semipermeable membrane (Transwell) on a 12-well plate. Then NK cells were stained with isotype control mAb (dotted line histograms), or anti–Rae-1 mAb (gray histograms). Solid line white histograms indicate anti–Rae-1 mAb staining of NK cells without coculture. (F) Cell surface expression of Rae-1γ on NK cells after coculture with RMA/Rae-1γ was analyzed by anti–Rae-1γ specific mAb (gray histogram) or isotype control mAb (dotted line histogram). Solid line white histogram indicates anti–Rae-1γ specific mAb staining of NK cells without coculture. (G) NK cells were stained with biotinylated anti-NK1.1 mAb, followed by DyLight 594-conjugated streptavidin. After 30 min of coculture with RMA/Rae-1δ, cells were stained with FITC-conjugated anti–Rae-1 mAb. Confocal microscopy imaging of NK cells alone (Left) and NK cells with RMA/Rae-1δ (Right) are shown. (Scale bars, 10 μm.) Representative data from three independent experiments are shown.
