
Figure 4.
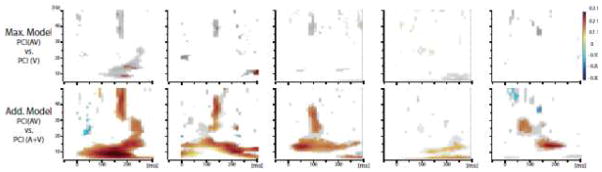
Example statistic for multisensory effects observed on Phase Consistency Index (PCI), for the five same contacts depicted in Figure 1. Top panel: the maximum criterion model. Bottom panel: the additive criterion model. Only significant values are shown, in color after correction, in black and white without correction.