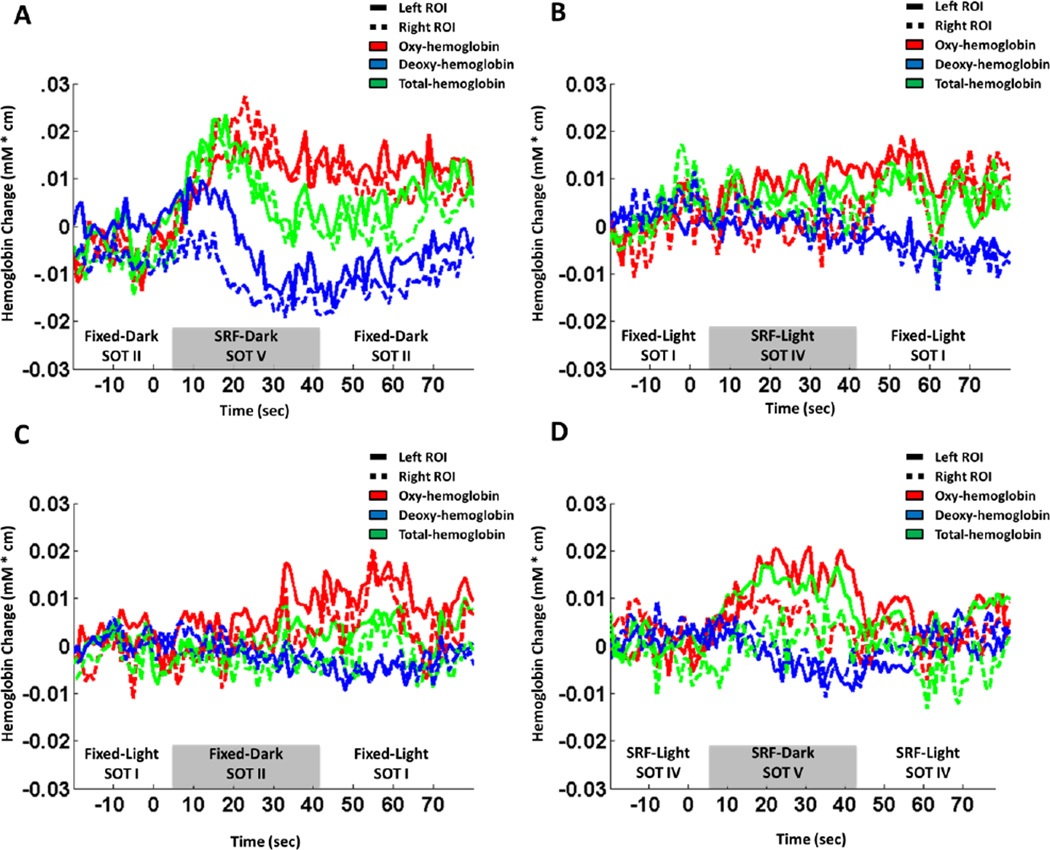
Figure 2.
The ensemble-averaged fNIRS time course for all four SOT combinations in this study in two (right and left, see figure 1) temporal-parietal source-detector combinations. These source detector combinations sample a region over the superior temporal gyrus (STG).

