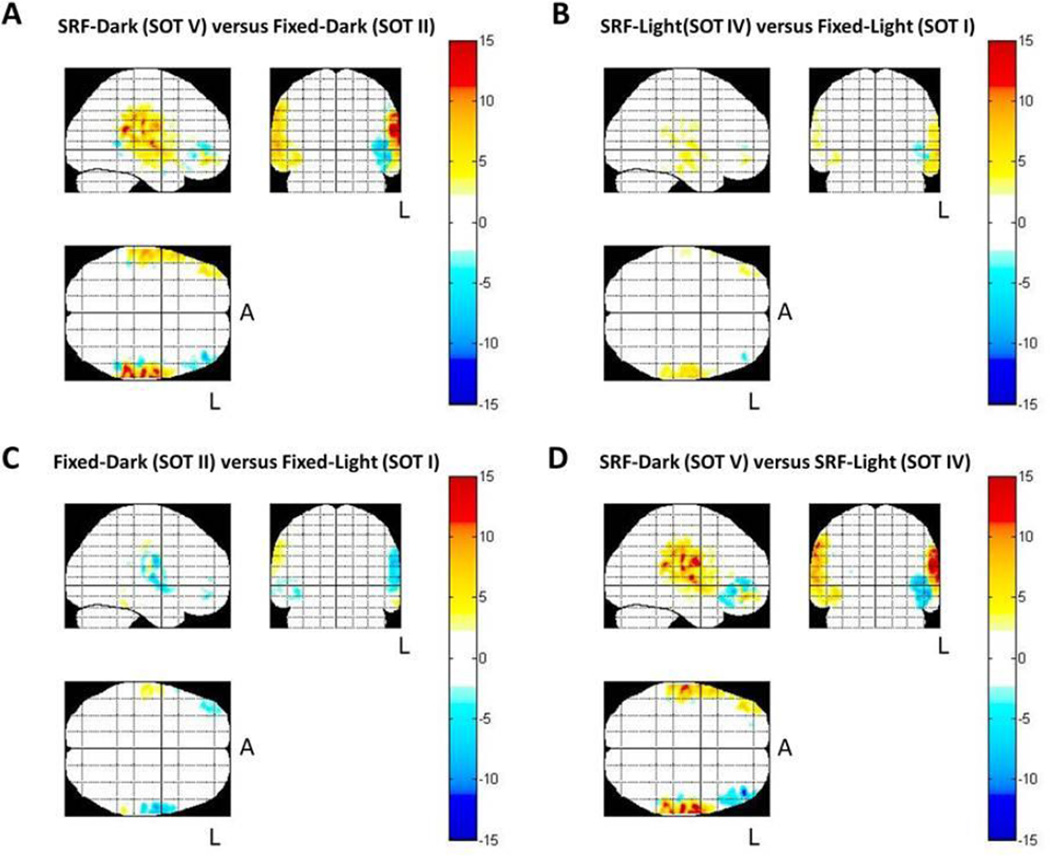
Figure 3.
Estimated spatial maps (T-test) of the oxy-hemoglobin data collected using fNIRS for the change in brain activity between the test and baseline conditions using all source-detector combinations. The color bar represents the results of the t-statistic (T-score). Areas in red indicate regions more activated (increased oxy-hemoglobin) during the comparison. Areas in blue indicate decreased oxyhemoglobin during the test condition in comparison to the baseline condition. Data are displayed as a maximum intensity projection along the sagittal, coronal, and axial directions. The L indicates the left side of the brain and the A represents anterior. Only areas with significant activation (p<0.05; corrected) are shown.

