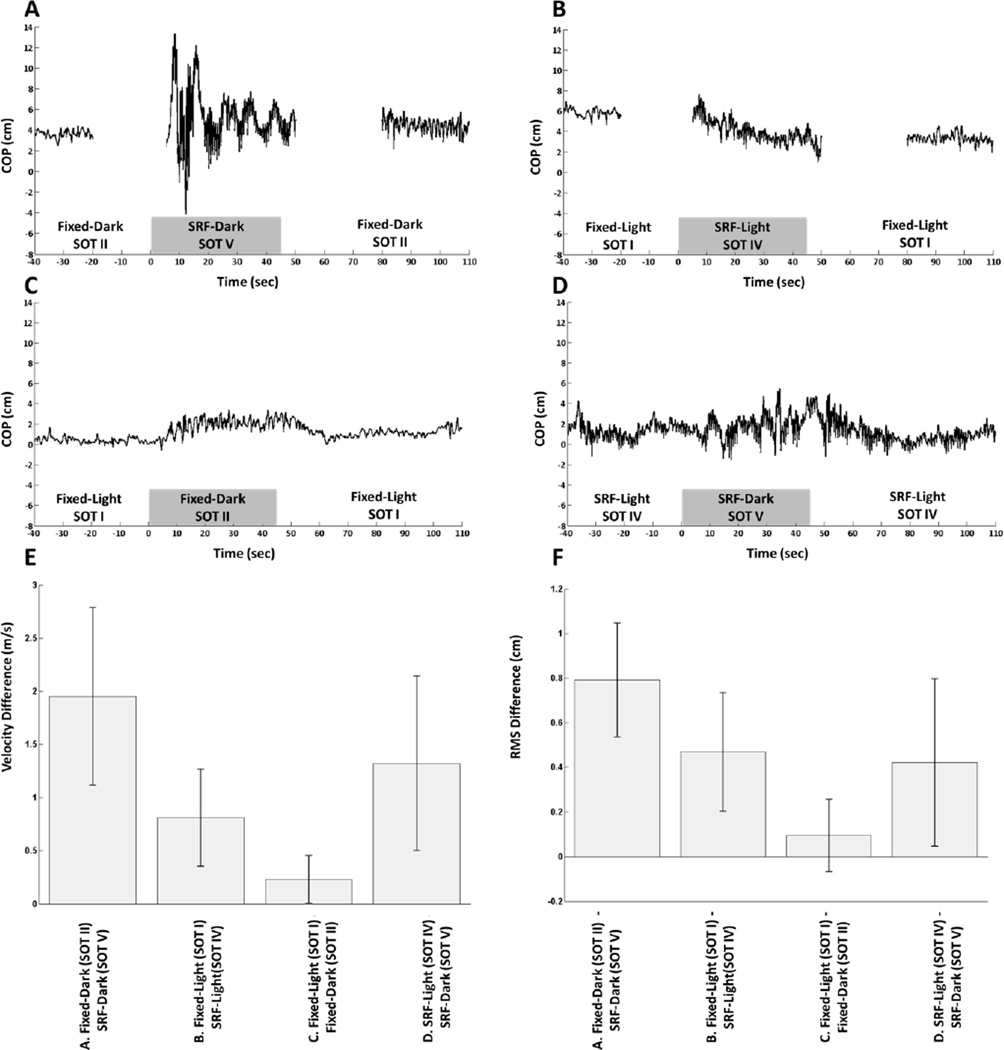
Figure 4.
Representative anterior-posterior center of pressure (COP) data from a single subject collected from the Equitest™ system (A-D). When subjects went from SOT II to SOT V and from SOT I and SOT IV, the COP data were collected in three separate files (indicated by a gap in the data) since the clinical Equitest™ system does not support a smooth transition between fixed to sway-referenced floor (SRF). FNIRS data were recorded continuously. Velocity difference (E) and RMS difference (F) were calculated across all subjects. Error bars represent one standard deviation.

