Figure 2.
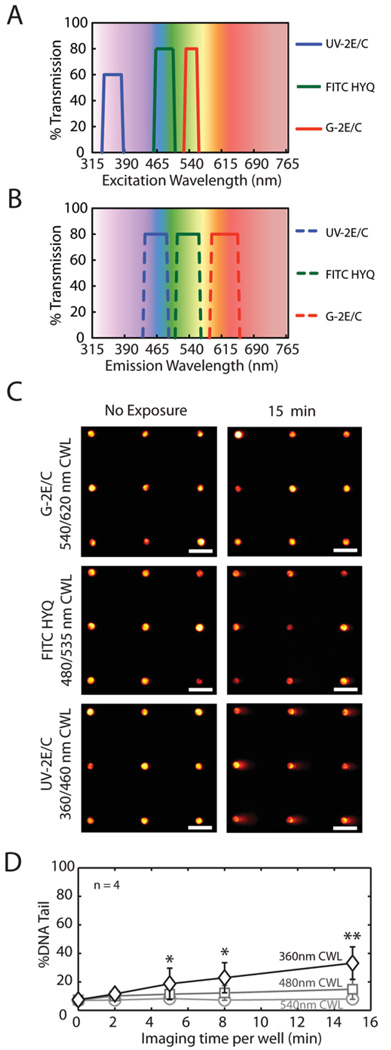
Fluorescence Microscopy excitation light-induced damage. Nikon 80i microscope fluorescent filter (A) excitation and (B) emission spectrum (Data compiled from manufacturer, Nikon). Filter names are according to manufacturer’s nomenclature. All filters are band pass filters with wavelength brackets plotted and center wavelength (CWL) listed in Table 1. (C) Arrayed microwell comets with varying exposure times to the specified wavelengths. Monochrome images were collected from microscope camera and colored with Red Hot lookup Table using Image J. Horizontal scale bars are 100 µm. (D) Comparison of light-induced damage under varying imaging/exposure times using TK6 human lymphoblasts. Each data point is the average of four independent experiments, where the median % DNA Tail of 100 individual comets was used to represent the extent of DNA damage. Error bars represent standard error of the four repeats. Symbols indicate a significant difference compared to non-exposed TK6 (Imaging time per well = 0 min) according to Student’s T-test: *p < 0.05, **p < 0.005.

