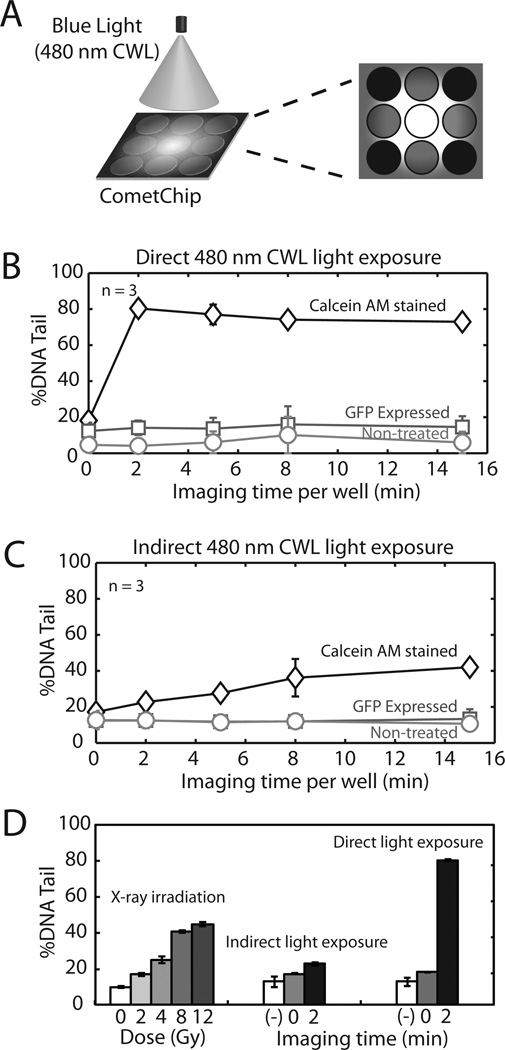
Figure 3.
Direct and Indirect light-induced damage in fluorescent cells. (A) Diagram indicating indirect light exposure in neighboring wells when imaging the center well. (B–C) DNA damage levels in U2OS cells exposed to direct and indirect blue light (480 nm CWL) from microscope. Data for control cells, cells expressing GFP, and Calcein AM-stained U2OS cells are shown. (D) Comparison of damage levels from X-ray irradiation and fluorescent imaging using Calcein AM. (–) represent wild type U2OS cells un-stained with Calcein AM. Data and error bars represent averages and standard errors of three independent experiments.

