
Figure 3.
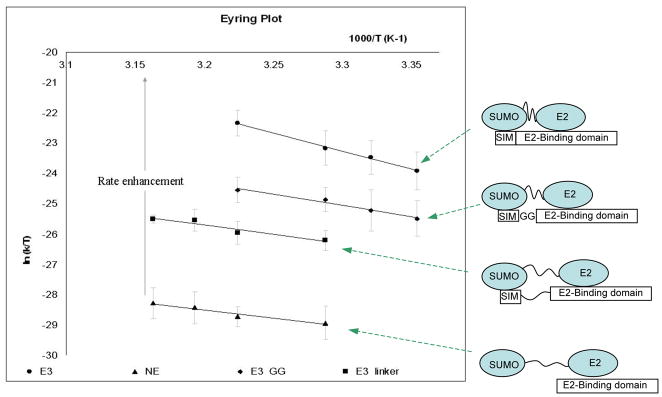
Eyring plots of kinetic experiments. Slopes of the plot were used to calculate the activation enthalpy, and the intercepts were used to calculate the activation entropy. Included are schematic drawings of each E3 variant and their expected effects on the E2~SUMO thioester conjugate.