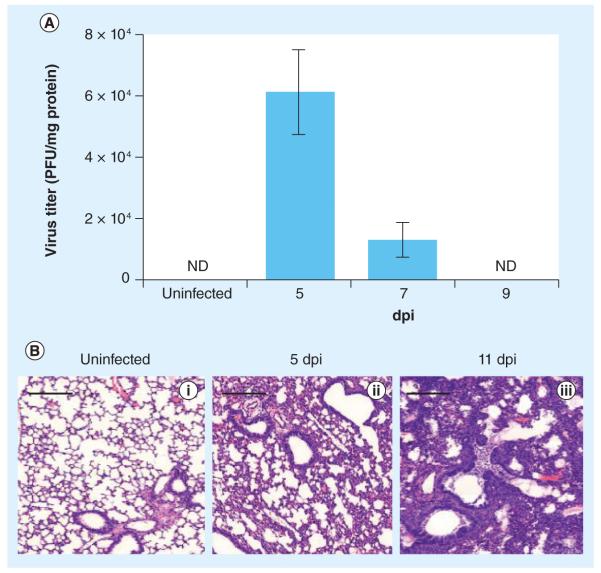
Figure 1. Infection kinetics of Influenza A in mouse lungs.
(A) Quantification of viral plaques from lung homogenates. PFUs are normalized to milligrams of protein in the lung homogenates (measured by Bradford assay) and represented as PFU ± standard deviation. (B) Prolonged inflammation in the lungs of influenza A/Puerto Rico/8/34-infected mice. Representative hematoxylin and eosin diagrams show (i) normal alveolar structure in uninfected mouse lung, (ii) thickening of alveolar walls with infiltration of immune cells on 5 dpi and (iii) severe lung infiltration and disrupted alveolar structures on 11 dpi, after virus has been cleared (n = 3).
Scale bars: 200 μm.
dpi: Days postinfection; ND: Not determined.

