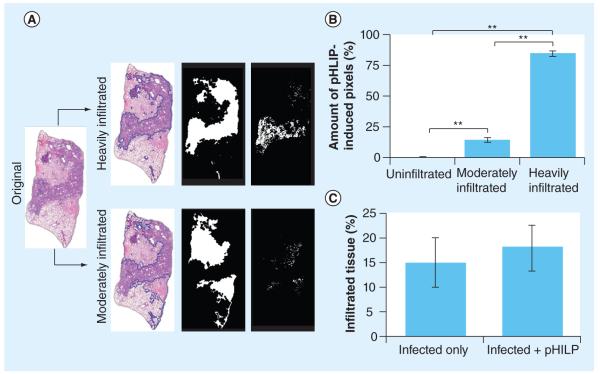
Figure 3. pH (low) insertion peptide targets heavily infiltrated lung tissue.
(A) Method of quantification for pHLIP in different regions of the lungs. Original hematoxylin and eosin images (left-most column) were segmented to distinguish heavily infiltrated and moderately infiltrated regions, which are traced in blue lines in the second column. Alveoli, bronchi and blood vessels were filled to generate alveolar areas, as shown in the third column. The total amount of pHLIP-induced fluorescence that overlapped with these alveolar areas (as shown in the right-most column) was then quantified. (B) pHLIP preferentially targets heavily infiltrated regions. Only 1.4 ± 0.7% of total pHLIP was found in uninfiltrated regions, while 13.7 ± 2.9% of pHLIP was found in moderately infiltrated regions and 84.9 ± 2.7% of pHLIP was found in heavily infiltrated regions. The percentage of pHLIP in different regions was calculated using two lung sections per mouse (n = 3). Bars indicate standard error of the mean. (C) pHLIP injection does not affect the degree of infiltration into mice lungs. Ten 5-μm thick lung sections at least 50 μm apart were obtained from infected mice injected or not injected with Hylite Fluor® 647 pHLIP. They were stained with hematoxylin and eosin and the percentage of heavily infiltrated tissue was quantified (n = 5). Data show that there is no significant difference between percentages of infiltration between these two groups.
**p < 0.01 (Student’s t-test).
pHLIP: pH (low) insertion peptide.

