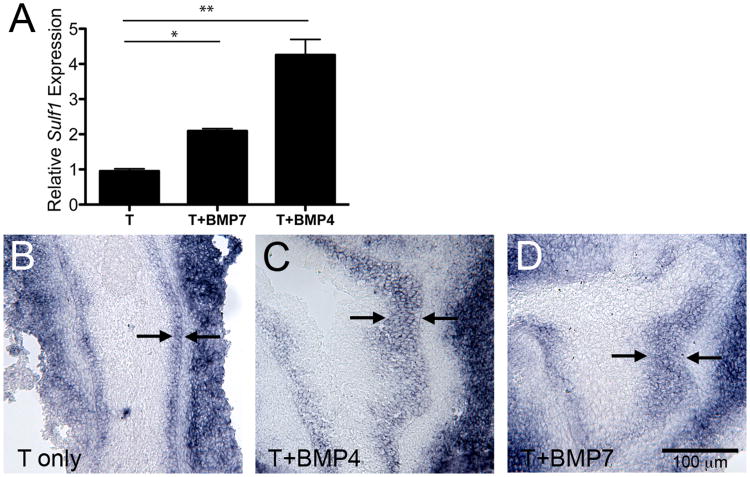
Figure 5. BMP4 and BMP7 induce Sulf1 expression.
E15 male UGS tissues were cultured with 10−8M testosterone (T) with or without the addition of 300 ng/mL BMP7 or 300 ng/mL BMP4 for 48 hours. Sulf1 mRNA relative expression was determined by real-time RT-PCR and was normalized to 18S mRNA expression (A). Graphs depict the average fold-change (± SEM) in expression relative to controls for a representative experiment (n=3 per group). Statistically significant increases in Sulf1 expression in response to BMP treatments were observed in four independent experiments (A, and data not shown). Statistical significance was determined by ANOVA with Bonferroni post-hoc analysis (*:P<0.01, **:P<0.0001). Spatial expression of Sulf1 mRNA was determined in serial sections of UGS tissues cultured in the presence of testosterone only (B) or with testosterone and BMP4 (C) or testosterone and BMP7 (D). Representative images show epithelial Sulf1 expression was restricted to a narrow band of peri-mesenchymal cells approximately three cell layers thick in testosterone only control tissues, and was expressed in a thicker band of peri-mesenchymal epithelial cell layers (arrows indicate Sulf1 expressing epithelial cells in each panel) in BMP treated UGS tissues. A scale bar for B-D is shown in D.

