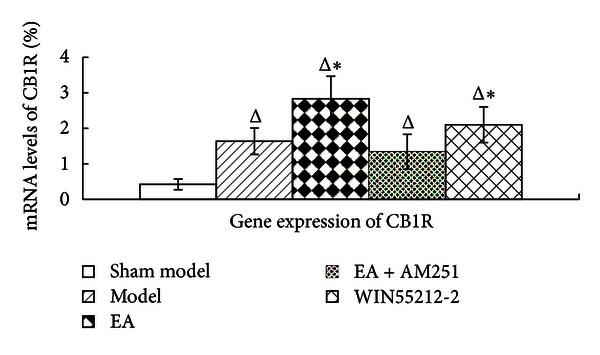
Figure 6.

CB1 receptor gene expression in the corpus striatum in rats in the indicated groups. The data are presented as mean ± SD (n = 5). FQ-PCR, fluorescence quantitative-polymerase chain reaction. Δ P < 0.05 versus sham-model group at the same time-point. *P < 0.05 versus EA + AM251 group at the same time-point.
