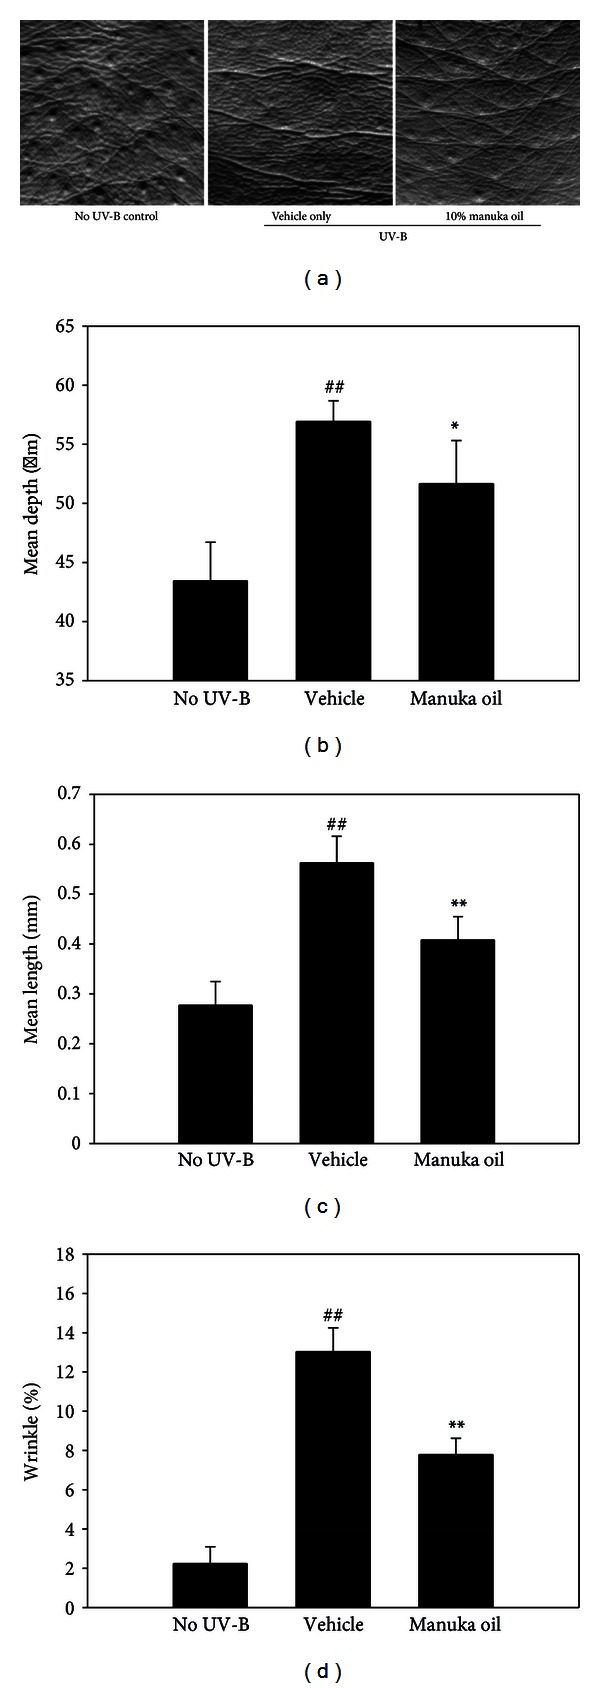
Figure 2.

Analysis of wrinkles using skin replicas taken from the dorsal skin. The skin replicas of no UV-B-irradiated control (no UV-B) group, vehicle only-treated group (vehicle), and the group that received 10% manuka oil (manuka oil), respectively, were generated at the end of the experiment. (a) Representative images taken from the replicas. Analysis of the replica images was performed using the Skin-Visiometer and its software for the determination of mean length of wrinkles (b), mean depth of wrinkles (c), and percentage of the wrinkle area (d). Values are means ± SEM (n = 6 per group). ##: significantly different from no UV-B control group (P < 0.01). * and **: significantly different from vehicle only group (**P < 0.01 and *P < 0.05).
