
Figure 1. Overview of osmoadaptation in S. cerevisiae.
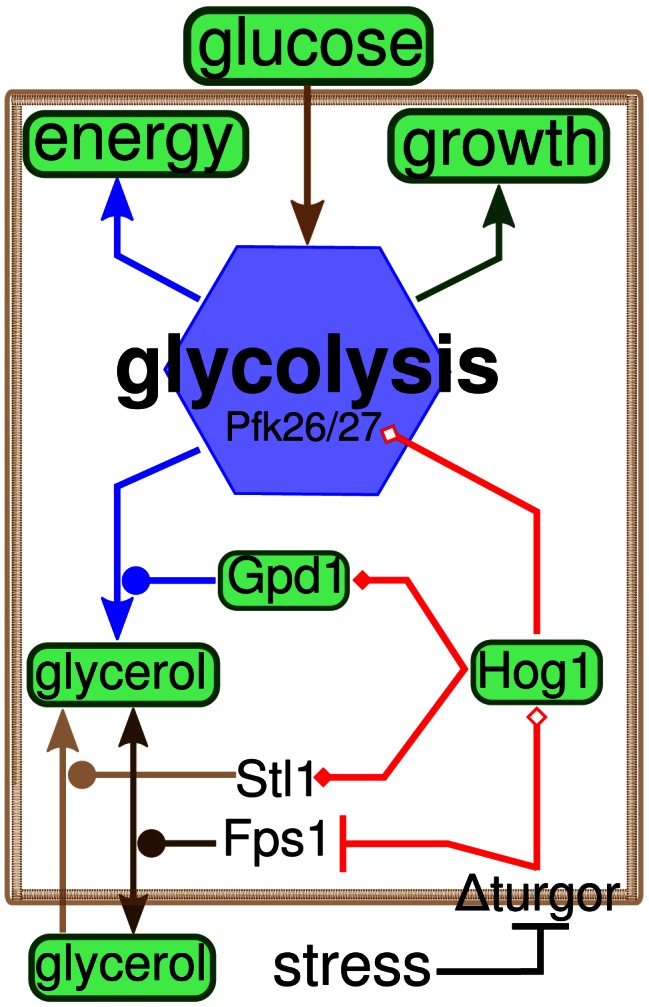
Arrows indicate mass flow, diamonds indicate positive regulation (empty: direct, filled: gene expression), circles indicate catalysis, bars indicate inhibition. Measured entities are highlighted green (for a complete list of experiments refer to SI). Processes are colored according to the different modules (transport: brown, glycolysis: blue, growth: green, adaptation: red).