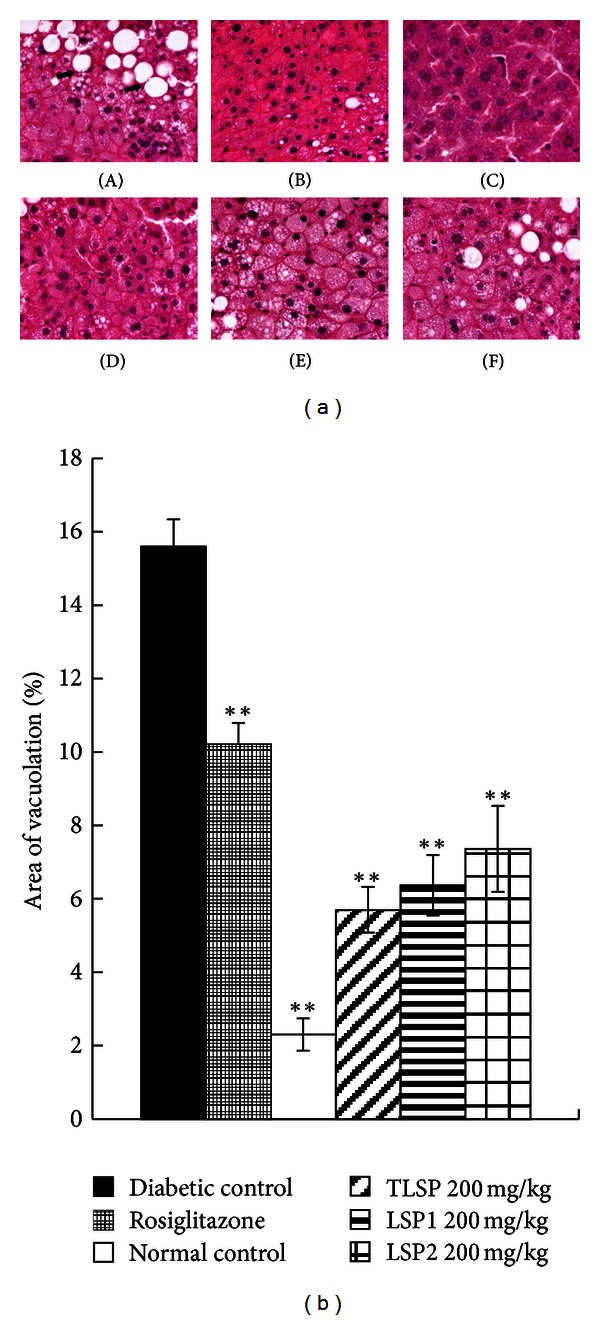
Figure 4.

Representative changes of morphology in obese KKAy mice. (a) Photomicrographs of H-E staining of the liver tissue in diabetic KKAy mice. (A) Diabetic control obese KKAy mice; (B) obese KKAy mice treated with rosiglitazone; (C) normal control C57BL/6J mice; (D) obese KKAy mice treated with TLSP (200 mg·kg−1·day−1); (E) obese KKAy mice treated with LSP1 (200 mg·kg−1·day−1); (F) obese KKAy mice treated with LSP2 (200 mg·kg−1·day−1). Severe hepatic steatosis (arrows) was evident in diabetic control obese KKAy mice, which were markedly ameliorated in TLSP, LSP1, and LSP2-treated obese KKAy mice. (b) Quantitative analysis of area vacuoation (%) in obese KKAy mice. Samples were stained with hematoxylin and eosin. Data were presented as mean ± SD (n = 7-8). *P < 0.05, **P < 0.01 versus diabetic control (vehicle treated).
