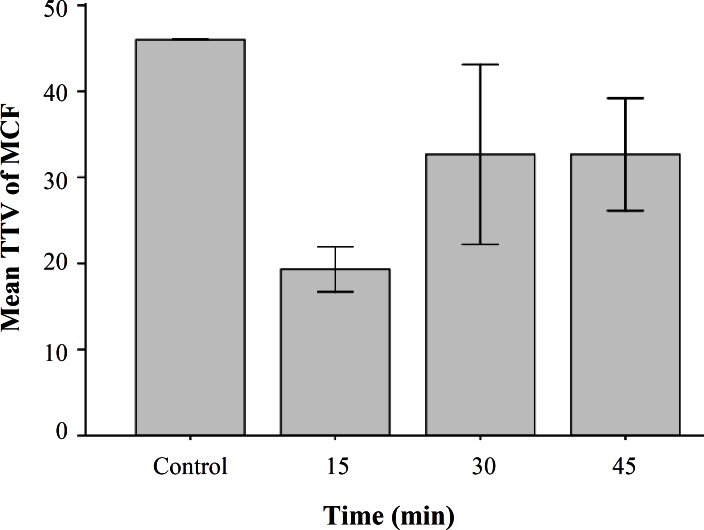
Fig. 1.
Intercellular levels of cellular glutathione using flow cytometry in HepG2 cells exposed to homocysteine. HepG2 cells were treated with D/L homocysteine (50 µM) for the indicated times and harvested for flow cytometric analysis of intracellular glutathione content using mean channel fluorescence (MCF) of thioltracker Violet dye (TTV). Analysis of cellular GSH content was restricted to PI negative (intact) cells. Values are means ± S.E and statistically different from control

