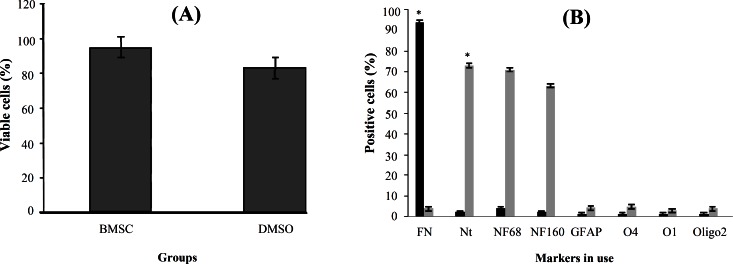
Fig. 2.
Histograms of quantitative analysis of viability and different markers by immunocytochemistry at pre-induction and induction stages. (A) The percentage of the viable cells in untreated and treated bone marrow stromal cells (BMSC) at pre-induction stage. The histogram shows the viable cells in untreated BMSC (control) and the DMSO-retinoic acid treated cells. The viability was higher in the control group compared to the other group. (B) Quantitative analysis of different markers by immunocytochemistry at pre-induction stage. Black columns shows untreated BMSC and light gray columns shows BMSC treated with dimethyl sulfoxide-retinoic acid. The fibronectin (FN) shows a significant difference in each group. *indicates statistical significance between BMSC and the other experimental groups (P<0.001). Nt, nestin; NF, neurofilament; GFAP, glial fibrilliary acidic protein.

