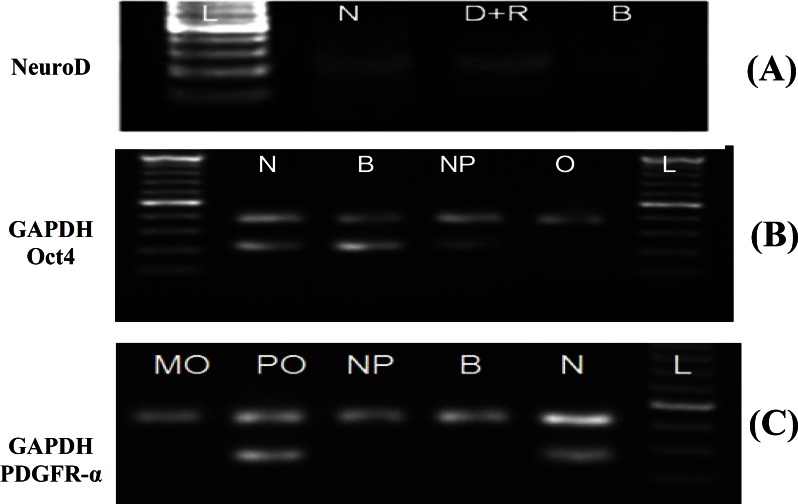
Fig. 3.
Electrophorograms of glyceraldehyde 3-phosphate dehydrogenase (GAPDH, 400 bp), NeuroD (220 bp), Oct-4 (210 bp) and platelet-derived growth factor α (PDGFR-α, 190 bp) using RT-PCR. (A) The electrophorogram of NeuroD gene expression profile at positive control (rat neonate brain, N), pre-induction stage (dimethyl sulfoxide-retinoic acid, D+R) and a negative control (untreated bone marrow stromal cells [BMSC], B). (B) The electrophorogram of Oct-4 gene expression profile in rat neonate brain (N), BMSC (B), neuroprogenitor (NP) cells and oligodendrocyte-like cells (O). (C) The electrophorogram of PDGFR-α gene expression profile in mature oligodendrocyte (MO), pre-oligodendrocyte (PO), neuroprogenitor cells (NP), BMSC (B) and rat neonate brain (N). L shows DNA ladder

