Fig. 4.
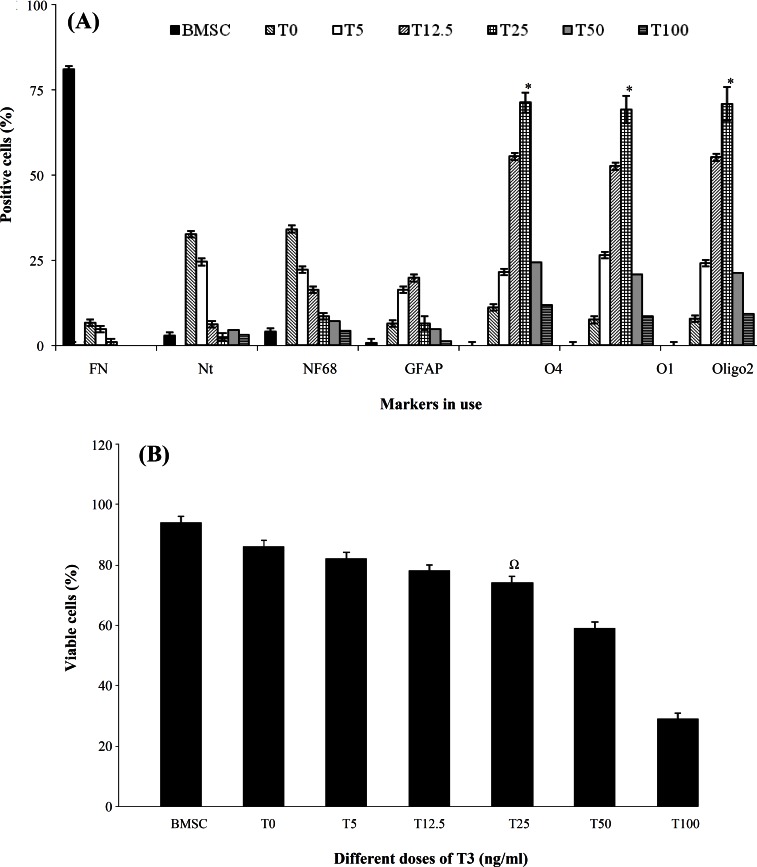
Histograms of quantitative analysis of viability and different markers by immunocytochemistry at induction stages. (A) The percentage of the immunoreactive cells. Triiodothyronine (T3) was added to the induction stage in concentrations of 0, 5, 12.5, 25, 50, 100 and 200 ng/ml. Untreated bone marrow stromal cells (BMSC) were used as a control group. In addition to T3, the cells were pre-induced with dimethyl sulfoxide-retinoic acid and induced with platelet-derived growth factor (PDGF), fibroblast growth factor and heregulin. The assessed markers were: fibronectin (FN), nestin (Nt), neurofilament 68 (NF68), glial fibrilliary acidic protein (GFAP), O4, O1 and Oligo2. There were statistically significant differences among the groups in the same stage. A significant increase was noted for percentages of O4, O1 and oligo2 (P<0.05), while NF68 was significantly increased in the pre-induction stage. ∗indicates a significant difference among cells treated with 0, 5 and 12.5 ng/ml of T3. (B) The percentage of viable cells at the induction stage in a dose response of T3 (0, 5, 12.5, 25, 50, 100 and 200 ng/mL) as an inducer following pre-induction with PDGF, basic fibroblast growth factor and heregulin. Increased T3 concentrations (50, 100 and 200 ng/ml) in the medium caused lower viability. Ω indicates a significant difference among cells treated with 0, 5 and 12.5 ng/ml of T3

