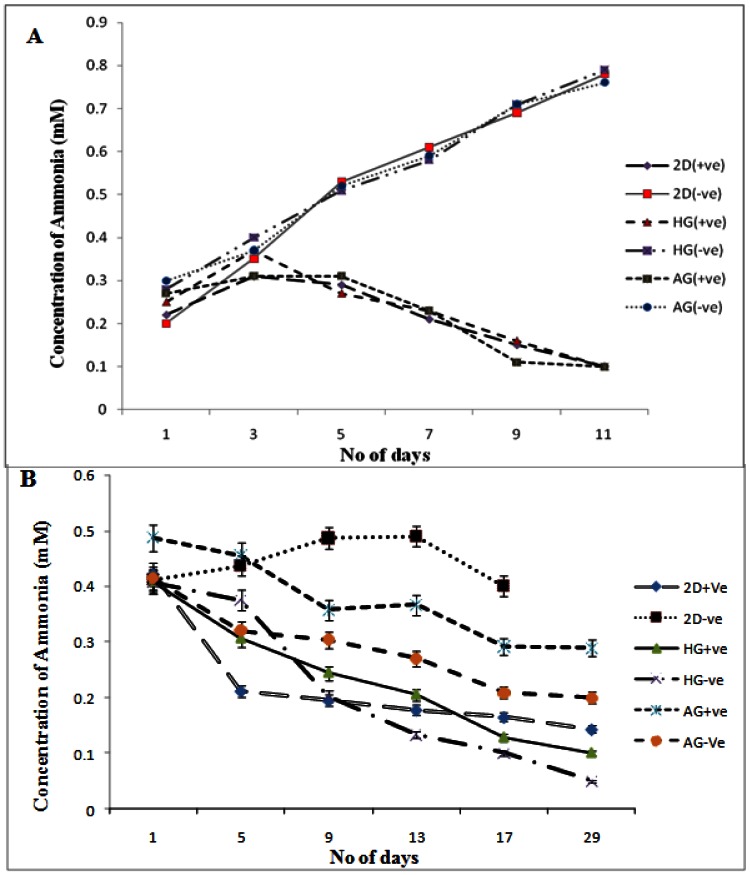
Figure 5.
Ammonia measurements in NIH3T3 and chondrocyte cultures in 2-D and 3-D conditions. HG is poly (hydroxyethyl methacrylate)-gelatin cryogel and AG is alginate-gelatin cryogel. (+ve) indicates experiment with α-KG and (-ve) indicates experiment without α-KG. Effect of α-KG on ammonia accumulation in NIH3T3 cells and chondrocytes derived by standard graph (0, 0.5, 1.0 mM concentration) was plotted to derive the R2 value, which was further used in determining the ammonia concentration in test samples. (A) The ammonia accumulation in NIH3T3 cultured in presence of α-KG in 3-D (HG, AG) and 2-D conditions in comparsion to expereiment set-up without α-KG (-ve). (B) Figure shows the concentration of the ammonia accumulated in the media when chondrocytes were cultured in the presence and absence of α-KG for a period of 29 days. All the experiments were performed in triplicates.

