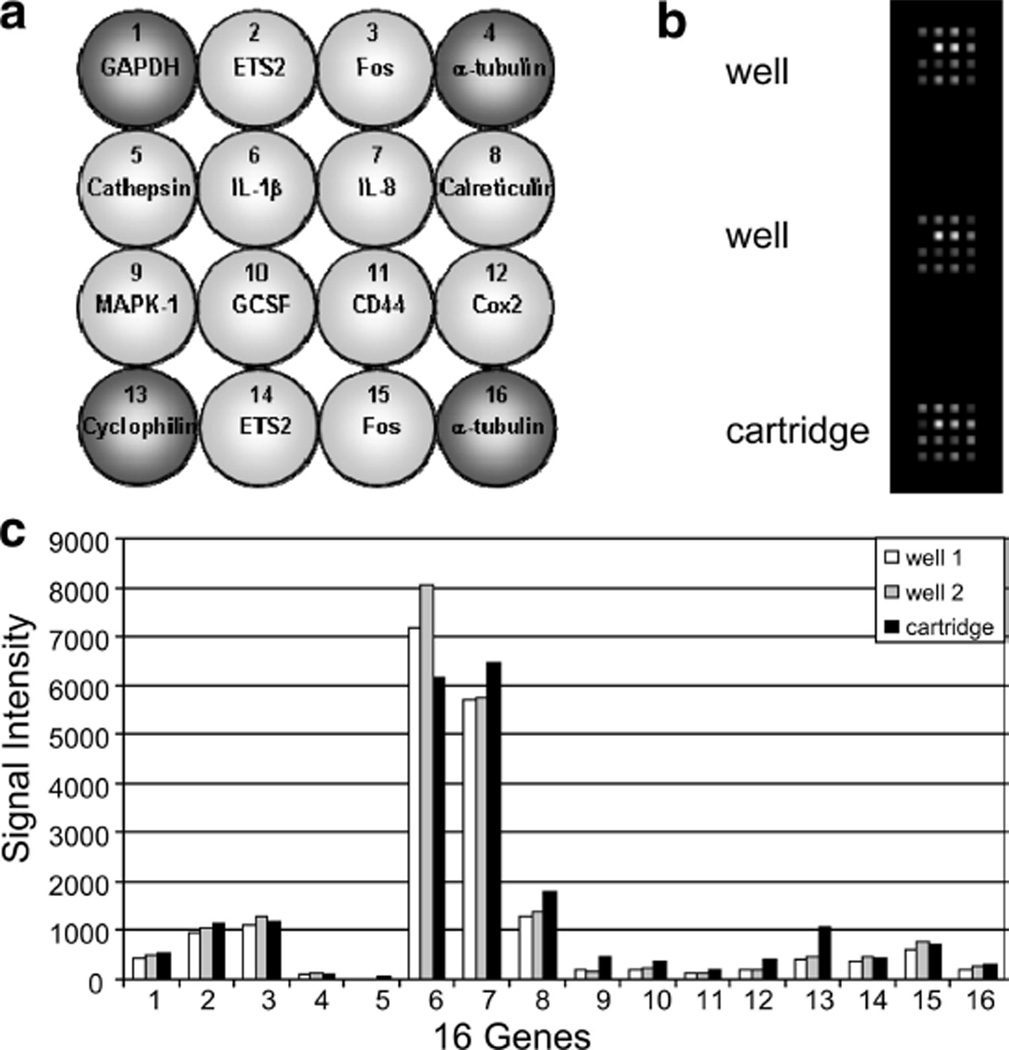
Fig. 2.
qNPA on the front-end cartridge. (a) Layout of the inflammation array. At the four corners are represented the housekeeping genes (dark grey) used to normalize the data. The other genes (light grey) are the genes being tested. (b) Composite image of the chemiluminescence emission captured at the position of the array element. Top and middle (well) are obtained from samples run in a 96-well array plate. Bottom image (cartridge) was obtained from sample run in the front-end cartridge (nuclease reaction), then transferred to the 96-well array plate. (c) Comparison of transcript level when the qNPA is run on the 96 well-array plate vs. the front end of the cartridge.

