
Figure 2.
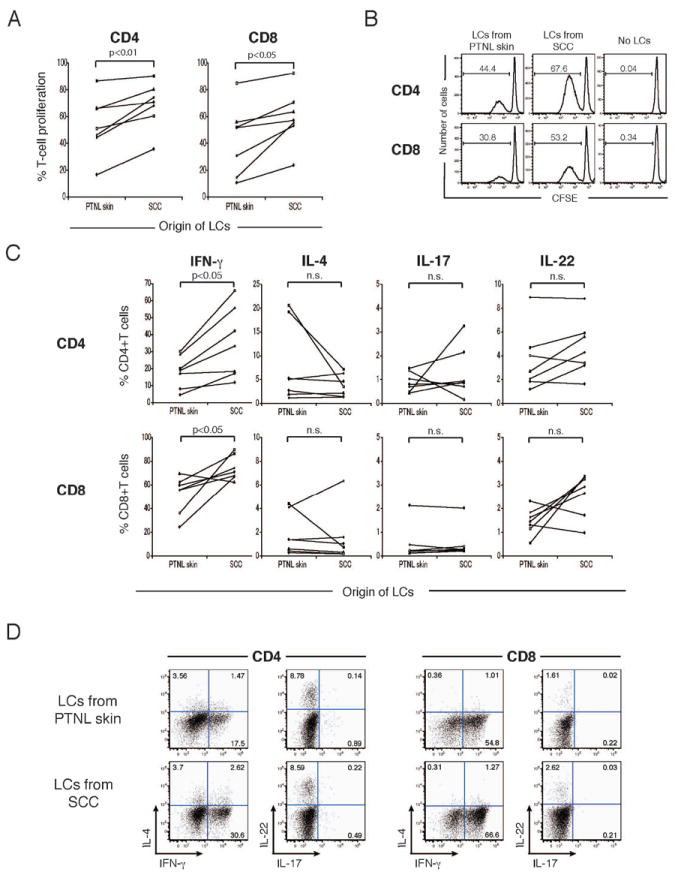
LCs from SCC stimulate proliferation of IFN-γ producing CD4+ and CD8+ T cells (A) CFSE labeled, allogeneic T were cultured with FACS-sorted LCs from SCC or PTNL. Percentages of proliferating cells within live CD3+CD4+ and CD3+CD8+ cells were determined by CFSE dilution (B) Representative FACS histograms of CFSE dilution assay using LCs form SCC and PTNL skin. Numbers show percentages of proliferating (CFSElow) cells. (C) Frequencies of cells positive for intracellular IFN-γ, IL-4, IL-17, and IL-22 detected in proliferating CD4+ and CD8+ T-cell populations following LC co-culture experiments. n.s., not significant. (D) Dot plot analysis of IFN-γ, IL-4, IL-17, and IL-22 expression in proliferating CD4+ and CD8+ T cells stimulated by LCs from SC vs. PTNL skin. Numbers indicate percent gated cells.