Fig. 2.

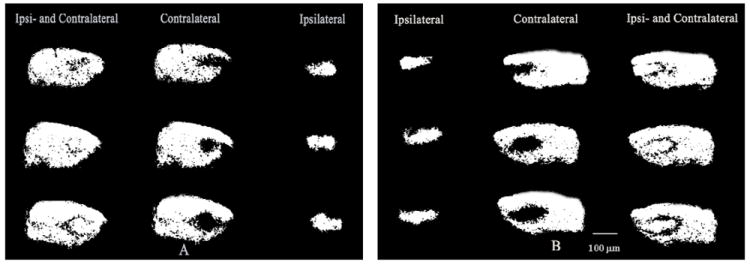
Gray scaled images of eye specific retinogeniculate projections in control mice at P10. A: the left eye projections and B: the right eye projections. Scale bar: 100 μm

Gray scaled images of eye specific retinogeniculate projections in control mice at P10. A: the left eye projections and B: the right eye projections. Scale bar: 100 μm