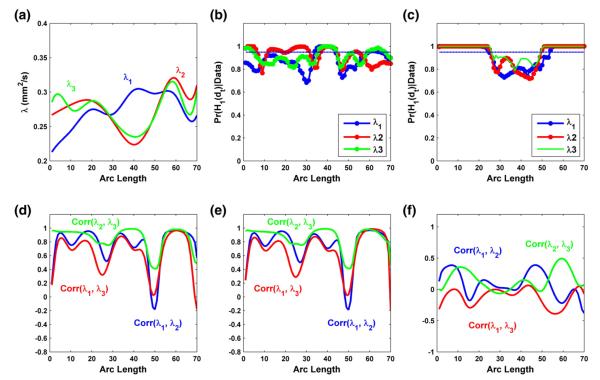
Fig. 11.
Results from the analysis of the three eigenvalues of diffusion tensor on the splenium tract: (a) the estimated mean functions for λ1 (blue), λ2 (red) and λ3 (green); the posterior probability curves (–) in favor of the grid point-wise alternative hypotheses for the gender effects in panel (b) and the gestational age effects in panel (c) (- - is the rejecting threshold); the estimated correlations among λ1, λ2 and λ3 for male infants at the mean gestational age in panel (d) and female infants at the mean gestational age in panel (e), and among the gestational age effects on λ1, λ2 and λ3 in panel (f).

