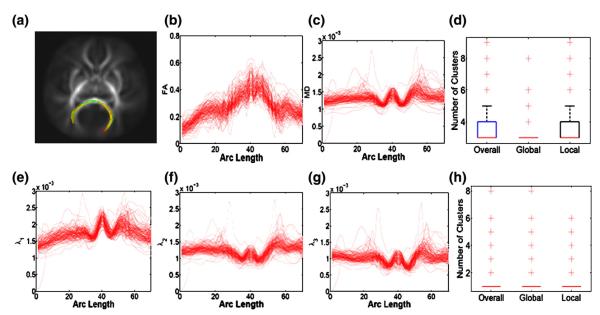
Fig. 8.
Splenium tract description: (a) the splenium capsule tract extracted from the tensor atlas with color presenting mean FA value; diffusion properties of FA in panel (b), MD (mm2/s) in panel (c), λ (mm2 1 /s) in panel (e), λ (mm2 2 /s) in panel (f), λ (mm2 3 /s) in panel (g); the number of clusters posteriori in FA and MD trajectories in panel (d) and the number of clusters posteriori in λ1, λ2 and λ3 trajectories in panel (h). The left-to-right direction of the arc corresponds to the right-to-left direction of the splenium tract.

