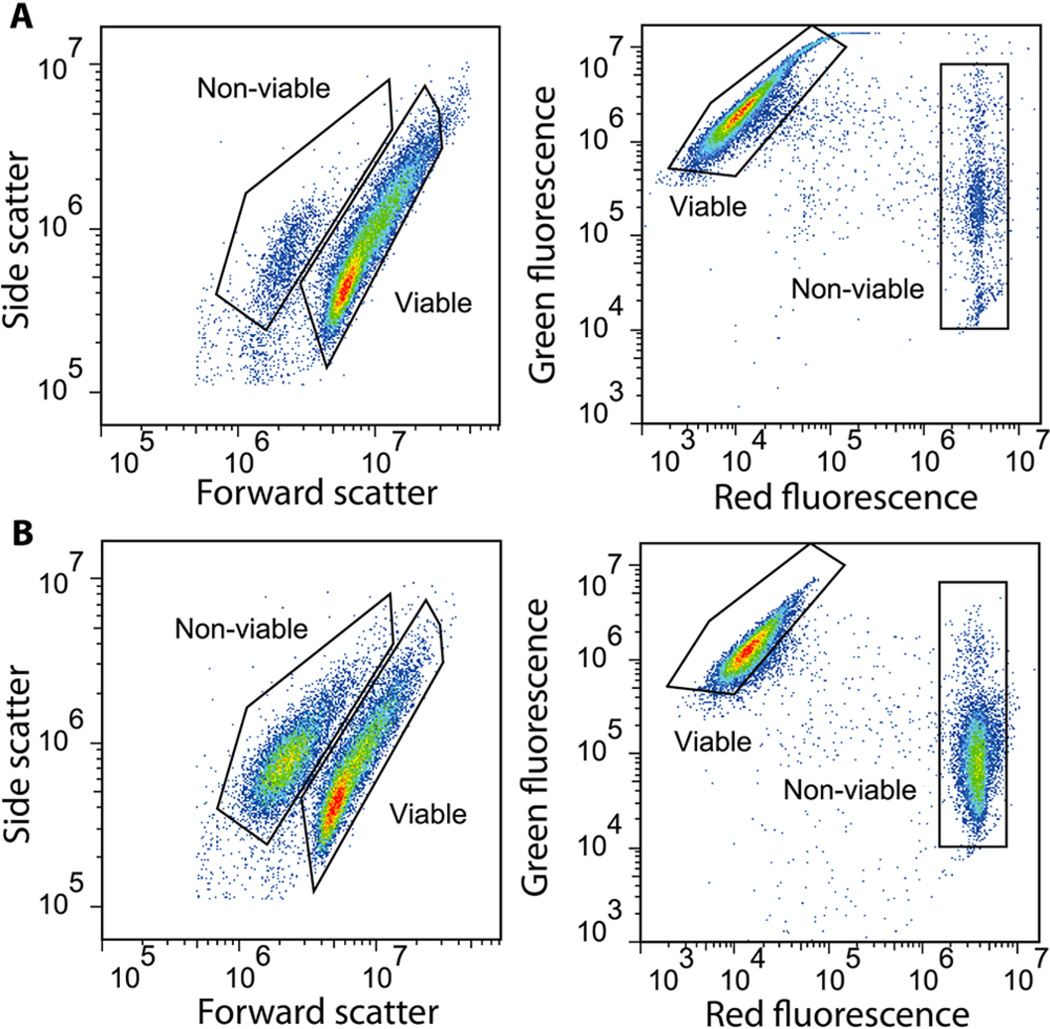
Figure 2.
Generating defined mixtures of viable/nonviable cells. Flow cytometry analysis of mixtures of viable and nonviable MCF-7 cells. Left plots show forward- and side-scattering intensities, and right plots show cells subjected to a two-color fluorescence assay that labels viable cells green and nonviable cells red. (A) In untreated cell solutions, the vast majority of cells (92.3–93.1%) are viable. (B) We subsequently tested our ability to generate defined mixtures of viable/nonviable cells by using high-salt PBS to induce apoptosis and analyzed a 60:40 mixture of viable/nonviable cells using the same cytometric gates. Our results confirmed that the resulting mixtures reflect the intended ratios.

