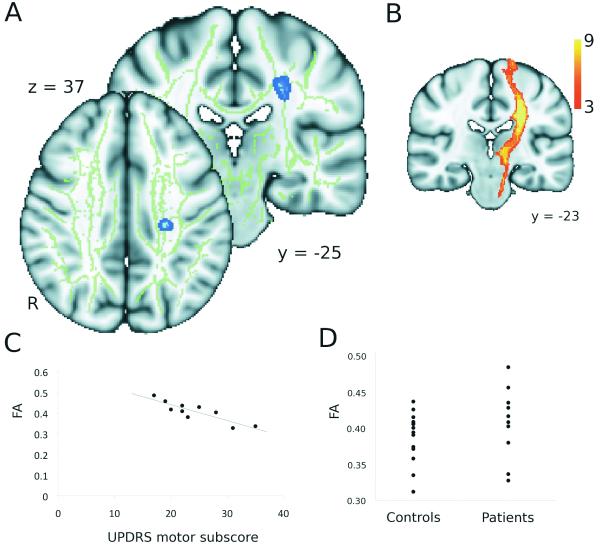
Figure 2. Correlations with clinical score.
A. The blue region indicates an area showing a significant correlation between UPDRS motor subscore and fractional anisotropy using voxel-based thresholding (t > 4.78, p < 0.001 (uncorrected), cluster extent > 25 mm3). B. The results of probabilistic tractography using this region as a seed mask in high-resolution data, demonstrating it lies within the left corticospinal tract, where the colour coding reflects the proportion of the population in which a tract is present. Tracts have been thresholded to show only those present in at least 3/9 subjects. C. Correlation between the UPDRS motor subscore and the fractional anisotropy within this region. D. Range of fractional anisotropy within this region in patients and controls. (Points represent individual subjects).

