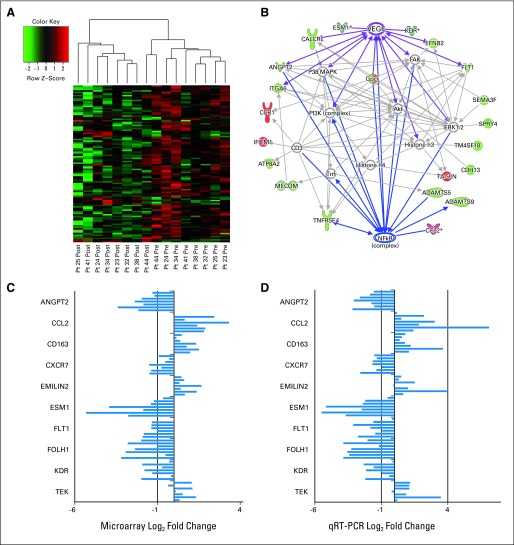
Fig 3.
Microarray expression analysis of tumor biopsies. (A) Hierarchical clustering of expression changes in biopsies from patients 23, 24, 25, 32, 34, 38, 41, and 44 for the top 100 differentially expressed genes based on adjusted P values before and after treatment with cediranib. Each row represents an Affymetrix probe set (Affymetrix, Santa Clara, CA); red indicates high expression, and green indicates low expression. (B) A representative Ingenuity Pathway Analysis map generated for the differentially expressed probe sets. Red nodes indicate genes that were upregulated by microarray, and green nodes indicate those that were downregulated; the more intense the color, the greater the log2 fold change in expression. (C and D) The log2 fold changes in expression from (C) microarray and (D) quantitative real-time polymerase chain reaction (qRT-PCR) analyses for cediranib-induced changes in individual patient samples. For each gene, results from patients 23, 24, 25, 32, 34, 38, 41, and 44 are listed sequentially from top to bottom; patient 23 did not have sufficient sample volume for qRT-PCR analysis.

