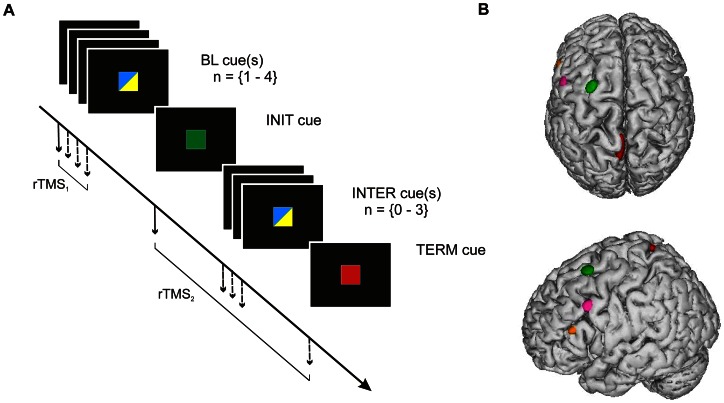
Figure 1. Trial time course and TMS target sites.
A. Time course of cue presentation in both tasks. A trial always started by the presentation of 1–4 baseline (BL) cue(s), which were either blue or yellow; it was followed by one green initiation (INIT) cue, 0–3 intermediate (INTER) blue or yellow cue(s) and a red termination (TERM) cue (see Methods and Fig. 2 for further detail). Each of the cues was displayed for 500 ms and was either a square in Experiment #1 (as shown on this Figure) or a letter (A, B or C) in Experiment #2. The delay between each cues was varied randomly, by step of 500 ms, from 2500 to 4000 ms. Two TMS trains (3 pulses at 10 Hz) were delivered during a given trial: one TMS train (rTMS1) was delivered at the onset of one of the BL cues, a second train (rTMS2) was delivered at the onset of either the INIT, INTER or TERM cue, as indicated by the arrows. B. Location of the TMS sites. The TMS sites are shown as ellipses on a lateral and superior views of a normalized brain. Each ellipse is centred on the mean MNI coordinates of the corresponding stimulation site (PMd in green, PB in pink, AB in orange and the control site in red). The surface of each ellipse indicates the 95% confidence interval of the normalized coordinates average for all subjects (n = 16).

