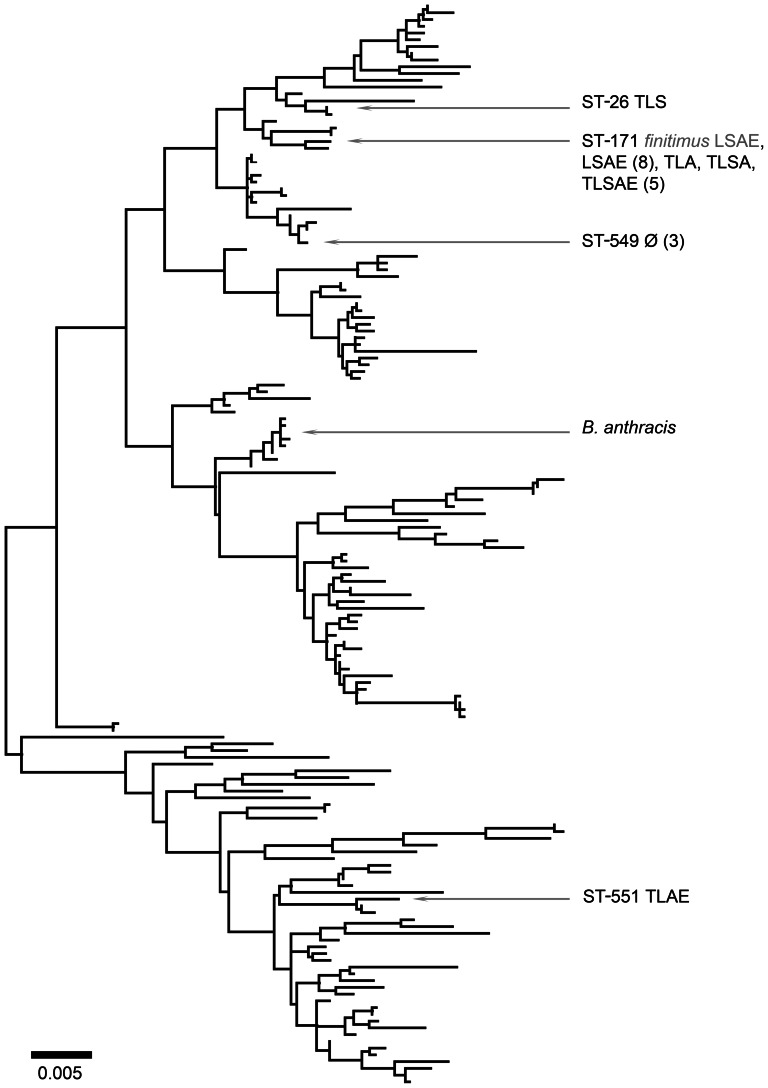
Figure 1. Un-rooted maximum likelihood analysis of Clade 1, with sequence types and corresponding phenotypes found in our sample indicated.
Numbers in parentheses indicate the number of isolates with the indicated phenotype observed in the ST. Light text indicates varieties and phenotypes described by de Barjac [3]; B. anthracis added for reference.

