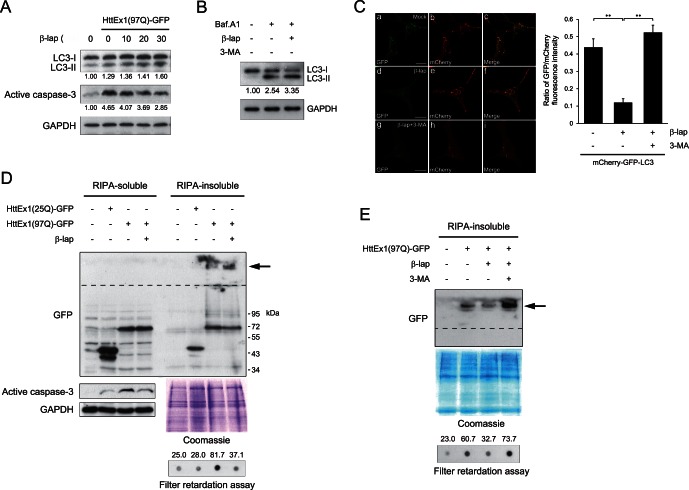
Figure 2. β-lap reduces polyQ aggregation through the induction of autophagy.
A. SH-SY5Y cells were transfected with the pcDNA or pcDNA-HttEx1(97Q)-GFP plasmid. After incubation for 24 h, cells were treated with various concentrations of β-lap for 12 h. Cell lysates were separated by SDS-PAGE, transferred onto a PVDF membrane, and probed with an antibody against LC3 or active caspase-3. GAPDH (detected with an anti-GAPDH antibody) was used as the loading control. The intensity of the protein bands was determined by using NIH ImageJ software. Numbers shown represent the expression ratios of LC3-II to LC-I, or the expression levels of active caspase-3. B. SH-SY5Y cells were treated with 30 nM β-lap for 7 h and further incubated with 400 nM bafilomycin A1 for 5 h. Cell lysates were separated by SDS-PAGE, transferred onto a PVDF membrane, and probed with an antibody against LC3. The intensity of the protein bands was determined by using NIH ImageJ software. Numbers shown represent the expression ratios of LC3-II to LC-I. C. SH-SY5Y cells were transfected with a mCherry-GFP-LC3 plasmid. After incubation for 24 h, cells were treated with 30 nM β-lap in the absence or presence of 10 mM 3-MA for 12 h. Cells were then fixed and observed under a confocal microscope. The ratios of GFP/mCherry fluorescence were plotted. Each bar and error bar represents the mean ± SD (n = 12); **p<0.01. D. SH-SY5Y cells were transfected with pcDNA-HttEx1(25Q) or (97Q)-GFP plasmid. After incubation for 24 h, cells were treated with DMSO or 30 nM β-lap for 12 h. Cell lysates were separated into RIPA-soluble and RIPA-insoluble fractions and analysed by Western blotting with an antibody against GFP (a–d). (a) PolyQ aggregates trapped in the stacking gel are indicated by an arrow, and the boundary between the stacking and separating gels is shown by a broken line. (b) Changes in the expression levels of active caspase-3 are shown to verify the activity of β-lap. GAPDH (detected with an anti-GAPDH antibody (c) and Coomassie blue staining of gels (d) were performed to ensure equal protein loading. (e) The accumulation of insoluble HttEx1(97Q) protein was examined by a filter retardation assay. The intensity of the spots was determined using NIH ImageJ software after immunoreaction with an antibody against GFP. Numbers shown are arbitrary indicators of spot intensity. E. SH-SY5Y cells were transfected with pcDNA or pcDNA-HttEx1(97Q)-GFP plasmid. After incubation with plasmids for 24 h, cells were incubated for another 36 h in the absence or presence of 30 nM β-lap and 10 mM 3-MA. RIPA-insoluble fractions were analysed as in (D).

