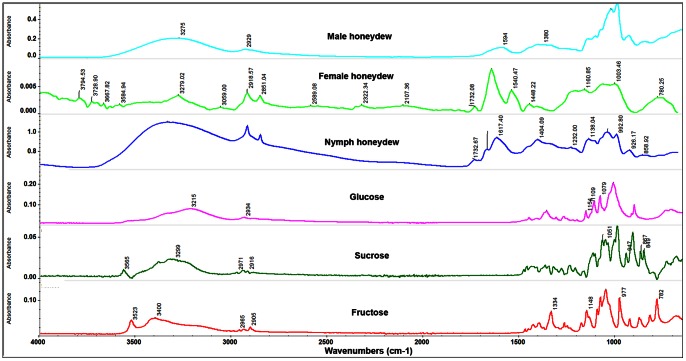
Figure 4. FTIR microscope reflection spectra of the surface of male, female and nymphal honeydew excretions (top three panels) compared to attenuated total reflectance FTIR spectra of typical monosaccharides.
The honeydew spectra contain many peaks attributable to simple saccharides, especially the broad peak centered at 3300 cm−1 attributable to the O–H bonds in sugars and water, and broad poorly resolved peaks at frequencies lower than 1500 cm−1 which indicate a mixture of the saccharides whose spectra appear in the lower three panes. However, the peaks at 2850 and 2910 cm−1 are more pronounced in the honeydew and the peak at 1733 cm−1 does not appear in the saccharide spectra. The male excreta show spectra typical of aqueous sugars.

