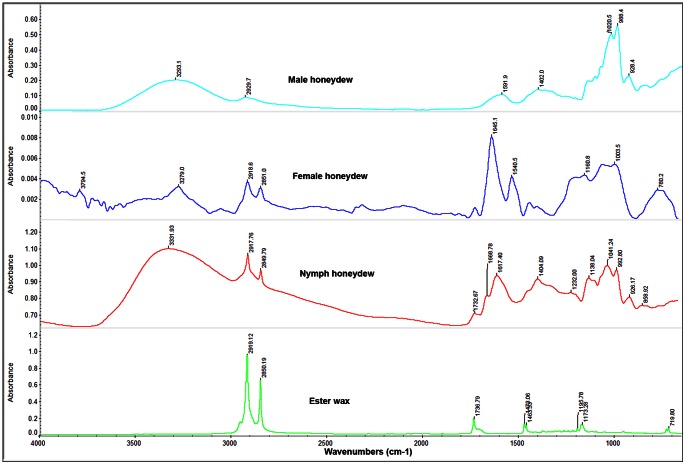
Figure 5. FTIR microscope reflection spectra of the surface of male, female and nymphal honeydew (top three panels) compared to attenuated total reflectance FTIR spectrum of beeswax, a typical ester wax.
While all the honeydew spectra are dominated by saccharide peaks (as shown in Fig. 4), the female and nymphal honeydew spectra are markedly different from that of the male. Peaks at 2850 and 2910 cm−1 (which are attributable to C–H bonds in a long chain aliphatic molecule) and the peak at 1732 cm−1 (which is attributable to the C = O of an ester carboxyl group) strongly indicate the presence of an ester wax on the surface of honeydew of females and nymphs.

