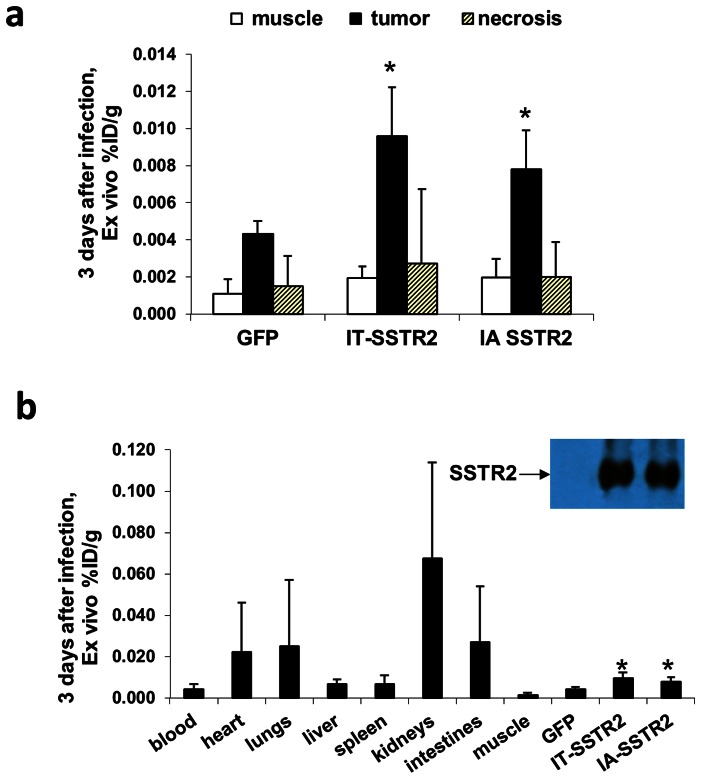
Figure 2. Ex vivo analysis of 111In-octreotide biodistribution in VX2 tumors 3 days after adenoviral infection.
(a) Graph showing significantly higher biodistribution in tumors infected with Ad-CMV-HA-SSTR2 after IA and IT administration compared to tumors infected with control Ad-CMV-GFP (*, p<0.01 for IA, n = 6 and p<0.02 for IT, n = 6). The %ID/g was higher in viable tumor tissue compared to areas of tumor necrosis (p<0.001 for IA and p<0.01 for IT, n = 6) or muscle (p<.001 for IA and p<0.001 for IT, n = 6). (b) Graph showing ex vivo tissue biodistribution of 111In-octreotide in multiple organs of rabbits bearing VX2 tumors infected in vivo with Ad-CMV-HA-SSTR2 or control virus. As in (a), increased uptake was seen in tumors infected with Ad-CMV-HA-SSTR2 by intra-arterial and intra-tumoral routes compared to tumors infected by intra-tumoral route with control Ad-CMV-GFP and this was further confirmed by Western blotting.

