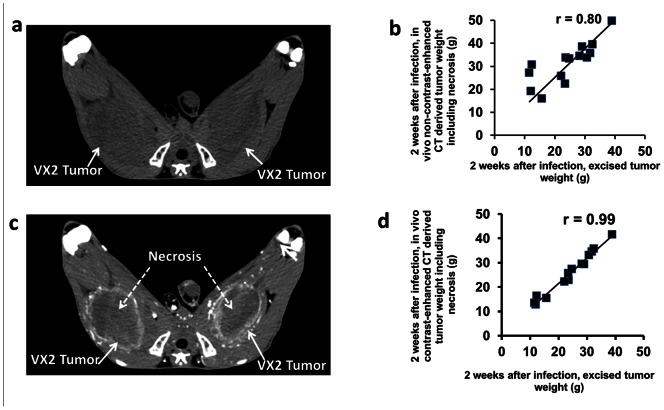
Figure 3. Representative transverse in vivo CT images of rabbit hind leg VX2 tumors.
(a) Unenhanced (without contrast) CT image acquired 24 days after VX2 inoculation in both thighs. Tumors appear as areas of low attenuation (arrows) and are relatively difficult to visualize. (b) Graph shows that weight derived from unenhanced CT images acquired 24 days after VX2 inoculation correlates well with weight derived from excised tumors (r = 0.80, p<0.001, n = 14). (c) Contrast enhanced CT image 24 days after VX2 inoculation in both thighs showing well-define peripheral rim enhancement of each tumor (solid white arrows). Areas of non-enhancing necrosis (central low attenuation material) are seen inside the tumor. (d) Graph shows that weight derived (with necrosis) from contrast-enhanced CT images acquired 24 days after VX2 inoculation correlates highly with weight derived from excised tumors (r = 0.99, p<0.001, n = 14).

