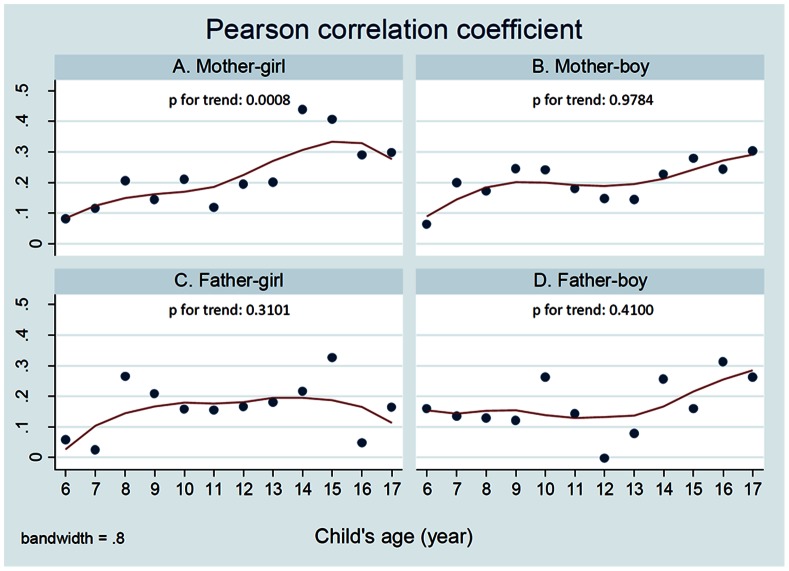
Figure 1. Age trends in the Pearson partial correlation coefficient between parent’s BMI and child’s BMI for age by dyad types.
X axis: Kid’ age. Y axis: Correlation coefficient r. P value for dyads: P = 0.0008 for mother-daughter pairs; P = 0.9784 for mother-son pairs; P = 0.3101 for father-daughter pairs; P = 0.4100 for father- son pairs.

