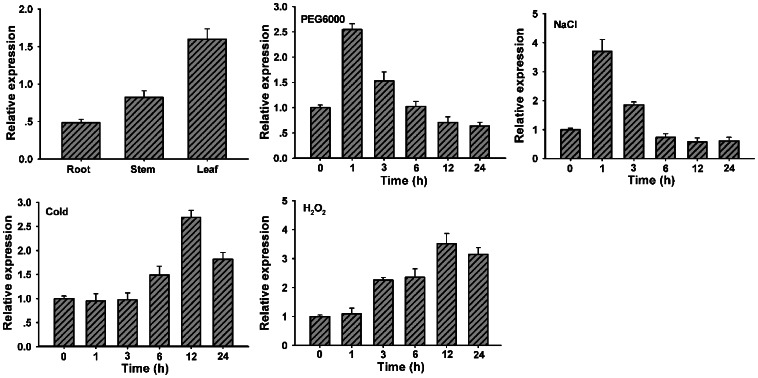
Figure 2. Expression patterns of wheat TaWRKY10 in different tissues and under different treatments.
The wheat seedlings were treated with 20% PEG6000, 200 mM NaCl, cold (4°C) or 10 mM H2O2. 200 ng Poly(A)+ mRNA was subjected to reverse transcription, and served as the qRT-PCR template. The y axis indicates the relative expression difference in mRNA level and the data were calculated using the 2–ΔΔCt formula. The transcripts of TaActin in the same samples was using as a reference. Transcript levels of the TaWRKY10 gene in untreated wheat were taken as 1. At least three biological experiments were carried out, which produced similar results.

