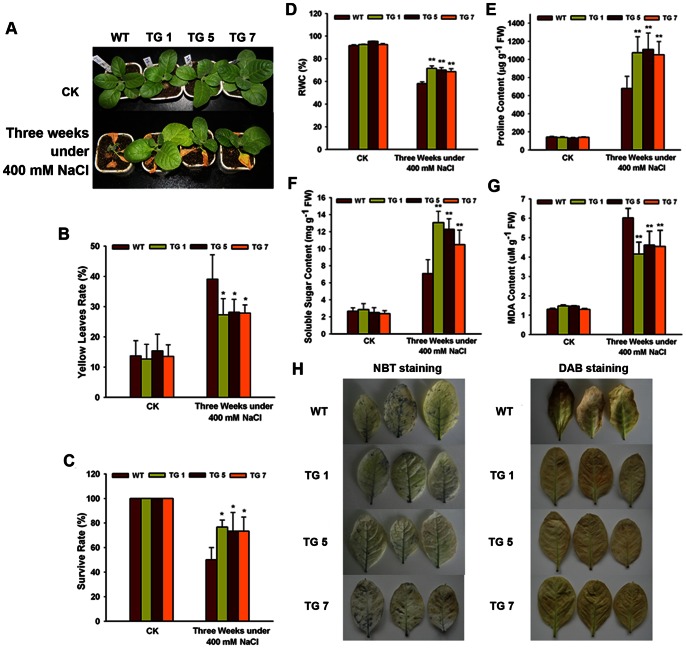
Figure 6. Analysis of the enhanced salt tolerance in transgenic tobacco lines.
(A) Phenotype of WT and TG tobacco after 3 weeks of 400 mM NaCl treatment; (B) Rate of leaf yellowing. (C) Survival rate. (D) RWC content. (E) Proline content. (F) Soluble sugar content. (G) MDA content. (H) Tissue localization of O2 − generation by NBT staining and tissue localization of H2O2 generation by DAB staining. The data present means ± SD of three experiments performed. Significant differences between the TG and control lines are indicated as *p<0.05; **p<0.01.

