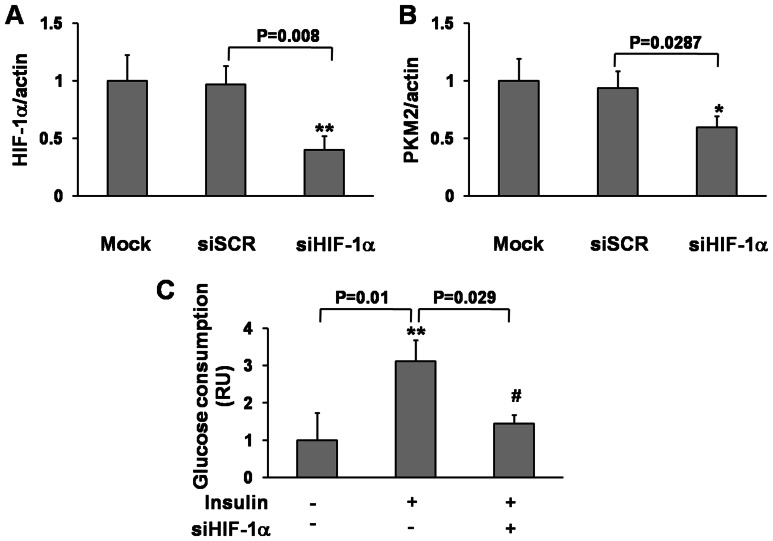
Figure 4. siHIF-1α inhibited HIF-1α and PKM2 expression and insulin-induced glucose consumption.
HepG2 cells were transfected with siHIF-1α (40 nM) and siSCR for 24 h. Protein levels of HIF-1α (A) and PKM2 (B) were analyzed by immunoblotting. Histogram represents the levels of HIF-1α and PKM2 normalized to β-actin (mean±SEM; n = 3). * and **, indicate significant decrease compared to the control (p<0.05 and p<0.01). (C) HepG2 cells were transfected with siHIF-1α and siSCR for 24 h, then starved for 18 h followed by insulin treatment for 6 h. Glucose assay of cells was tested as above. The data were analyzed by ANOVA. **, indicates significant increase compared to the control without insulin treatment (p<0.01); #, indicates significant decrease compared to siSCR and insulin treatment (p<0.05).

