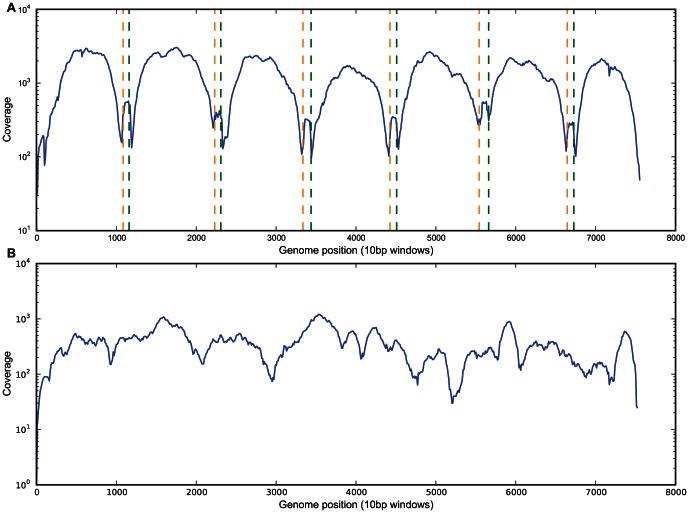
Figure 1. Coverage profiles of one Norovirus sample from amplicon and direct RNA sequencing.
A – Coverage across the genome for one Norovirus sample sequenced from PCR amplicons (others similar). Green and orange dotted lined mark the locations of the PCR primers used to generate the amplicons. B – coverage across the genome for the same Norovirus sample sequenced directly from RNA.

