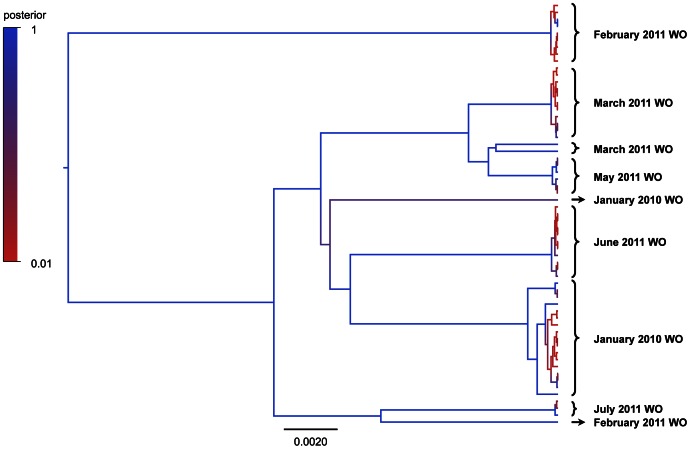
Figure 3. Evolutionary tree created by BEAST (Bayesian evolutionary analysis sampling trees) depicting all the full genomic sequences with relatedness (61 sequences, excluding repeated pairs).
Clusters of genomes are visible among viruses sampled at similar points in time. Whole genome sequencing gives adequate resolution to distinguish potential divergent viral strains within the same time, as illustrated in clusters from January 2010, February 2011 and March 2011. WO = ward outbreak. Each node and branch has been coloured depicting the posterior probability supporting that clade calculated by Bayesian analysis (Dark Blue = 1 (high); Light Red = 0 (low)). Analysis was performed using BEAST v.1.7.5 combining two random number seed chains (10 million iterations each, saving 1 in 1000 iterations, with a 1 million iteration burn-in) using: HKY substitution; estimated frequency; strict clock; and constant population size coalescent tree prior. This maximum clade credibility tree was computed using TreeAnnotator v.1.7.5 and plotted with Figtree v.1.4.0.

