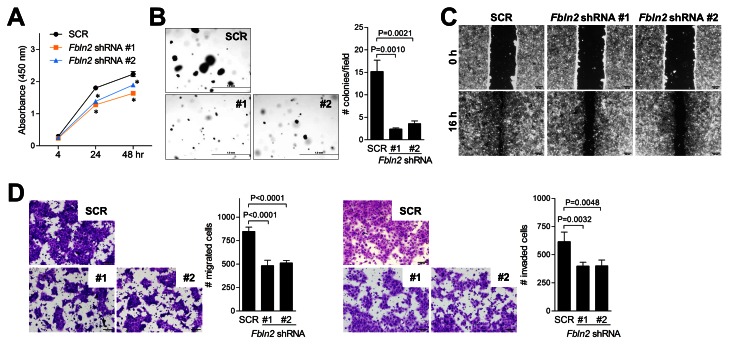
Figure 4. Fibulin-2 promotes 344SQ cell proliferation, migration, and invasion.
(A) Cell proliferation (WST-1) assays to quantify relative cell density of transfectants grown in monolayer cultures. Results expressed as mean values of triplicate wells (± S.D.) at each time point. Asterisks indicate P < 0.01, SCR shRNA versus Fbln2 shRNA. (B) Colonies of transfectants grown in soft agar were photographed and counted after 21 days. Results expressed as mean values (± S.D.) of triplicate wells (bar graph). (C) Images of confluent cultures subjected to scratch-wounds after 16 hours. (D) Migration and invasion assays of transfectants loaded into upper chambers of Boyden apparatus in the presence of 10% serum in bottom chamber as chemo-attractant and 1 µg/mL mitomycin C to block cell proliferation. Cells migrating or invading through the filters were stained with crystal violet, photographed, and quantified. Results represent the mean values (± S.D.) of quadruplicate samples (bar graph). P-values are indicated (t-test).

