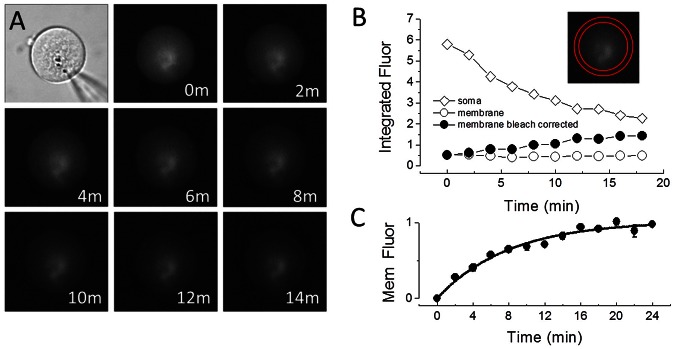
Figure 2. Prestin delivery to the cell surface can be monitored in real time by fluorescence measurements.
A) A phase-contrast image and consecutive YFP fluorescence photos taken every two minutes, simultaneous with NLC measurements as in Figure 1 . Exposure conditions: SPOT CCD camera, 8 second exposure, 16× NDF, 40× lens. While there is a clear photo-bleaching effect intracellularly, the fluorescence intensity on the cell membrane is kept near constant, indicating an added component from trafficking. B) Measurement of intracellular integrated fluorescence density (open diamonds) and that of the membrane (open circles) as indicated by the ROI in the photo insert. Following bleach correction according to Equations (2–5) membrane fluorescence shows an increase over time (filled circles). C) Membrane fluorescence changes for each time point as measured above were averaged (+/− se, n = 14 cells) and normalized. Normalized NLC data were fit with a single exponential, τ being 7.9 minutes. As with NLC, the plateau likely reflects the depletion of membrane-bound YFP-prestin molecules from the trans-Golgi complex.

