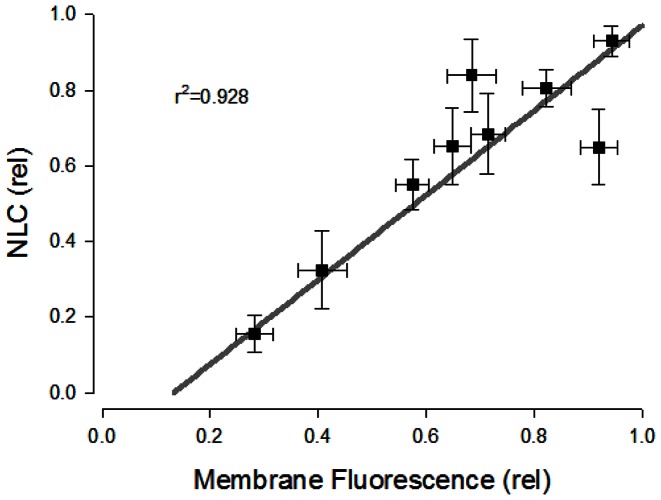
Figure 3. Correlation of membrane surface fluorescence and NLC.
Data from Fig. 1C and Fig. 2C are plotted against each other. The high correlation (r2 = 0.983) between the two confirms that either can be used to monitor kinetics of prestin delivery to the plasma membrane following release from T-block.

