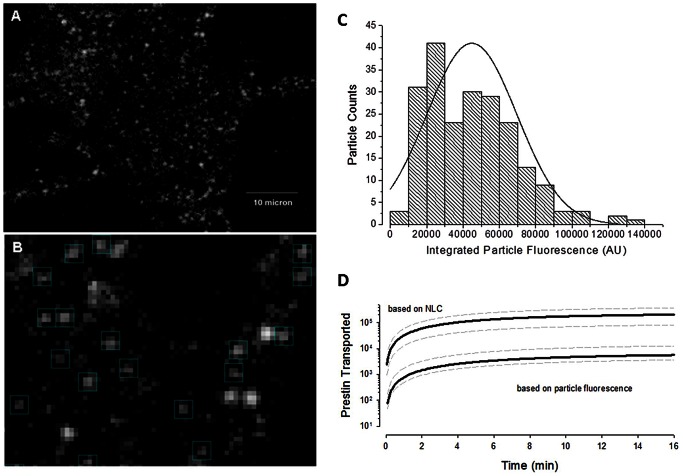
Figure 4. Estimates of prestin monomers deleiverd to the membrane following release from T-block.
A) Prestin molecules transported to cell membrane visualized as diffraction-limited fluorescence spots consistent in size with single molecules (Hallworth and Nichols, J Neurophysiology, 2011). Membrane pieces observed with fluorescent microscope under the same condition as described in Fig. 2 for monitoring trafficking. Scale bar 10 µm. B) Enlarged view for particle picking for fluorescence quantification. Uniform box size 4×4 square pixels corresponding to 760×760 nm2 area, very close to the box size used by Hallworth et al. (750×750 nm2). Bright, larger spots likely representing multiple particles were excluded. Integrated fluorescence of each spot was quantified after global background correction, the same way as done in Fig. 2 . C) Particle intensity distribution. Data were automatically binned and fitted in Origin. The fact that the regression line does not pass through the origin may indicate that non-functional fluorescent monomers contributed to membrane fluorescence. D) Estimates of monomer deposition into the membrane obtained using NLC or fluorescence measures (see Methods). Grey dotted lines depict +/− standard deviation. Note discrepancy, with NLC estimates giving greater than an order of magnitude increase in numbers of monomers.

