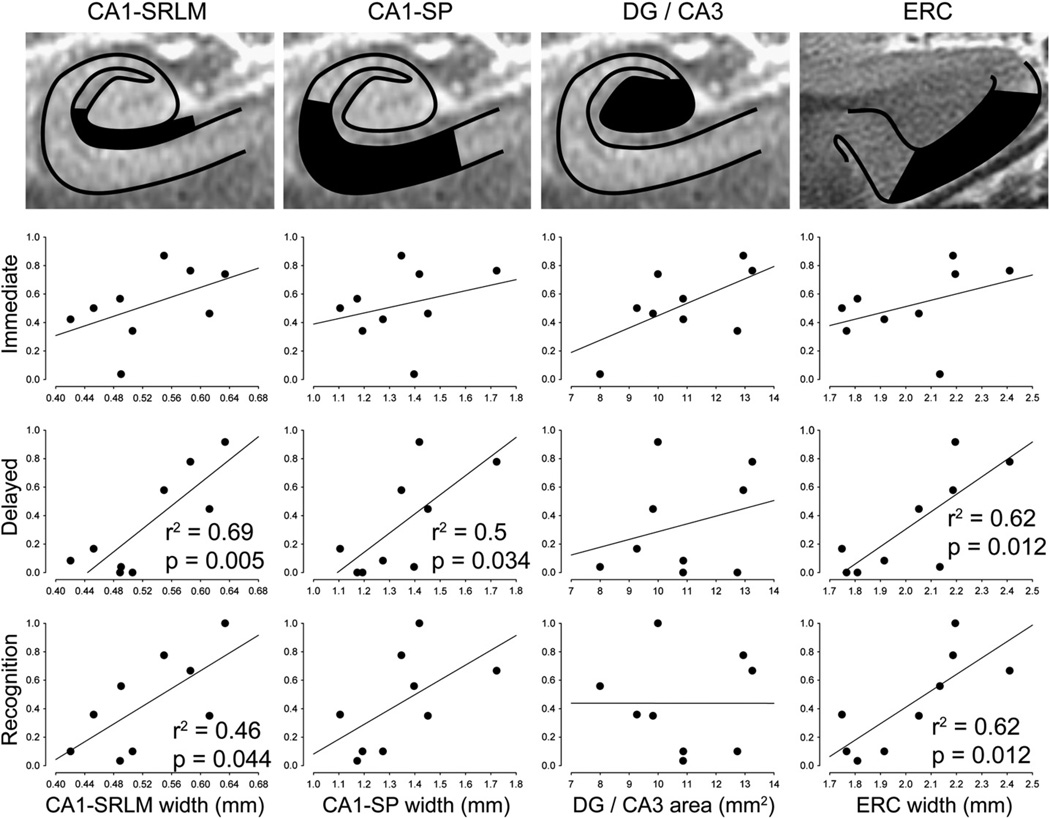
Fig. 3.
Microstructural correlates of memory performance. Scatter plots are illustrated for composite scores of immediate recall, delayed recall, and delayed recognition (see Methods), versus each of the main microstructural metrics: CA1-SRLM width, CA1-SP width, DG/CA3 cross-sectional area, and ERC width. Statistics are shown only for significant correlations; also see Table 2. CA1-SRLM and CA1-SP widths were determined using a semi-automated method (see Fig. 2).

