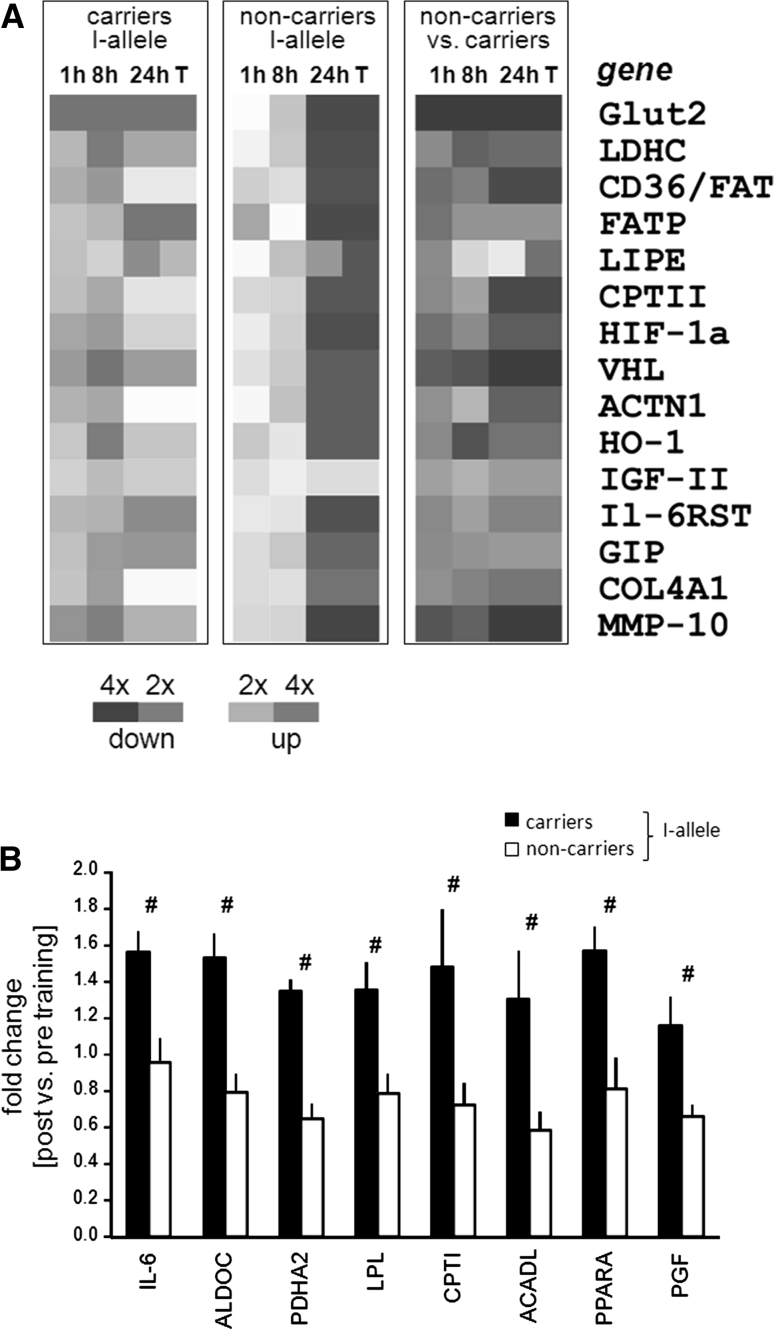
Fig. 3.
Genotype dependent expression changes to endurance exercise. a Heat map visualizing the regulation of the 15 gene transcripts and their functional ontology demonstrating level differences between carriers and non-carriers of the ACE I-allele in vastus lateralis muscle during recovery from bicycle exercise and after bicycle training. Colour code denotes the scale of fold changes 1, 8, 24 h after endurance exercise and training versus baseline in carriers of the I-allele, non-carriers of the I-allele, and the corresponding ratio between the two genotypes. b Bar graph of mean + SE for fold changes in training-induced expression for 8 transcripts which distinguished between ACE genotypes after training. #, q-value <5 %/231 for differences in fold changes between genotypes. n = 12. For abbreviations see legend to Fig. 4

