
Table 1.
Univariate comparison between gallbladder polyp group and control group*
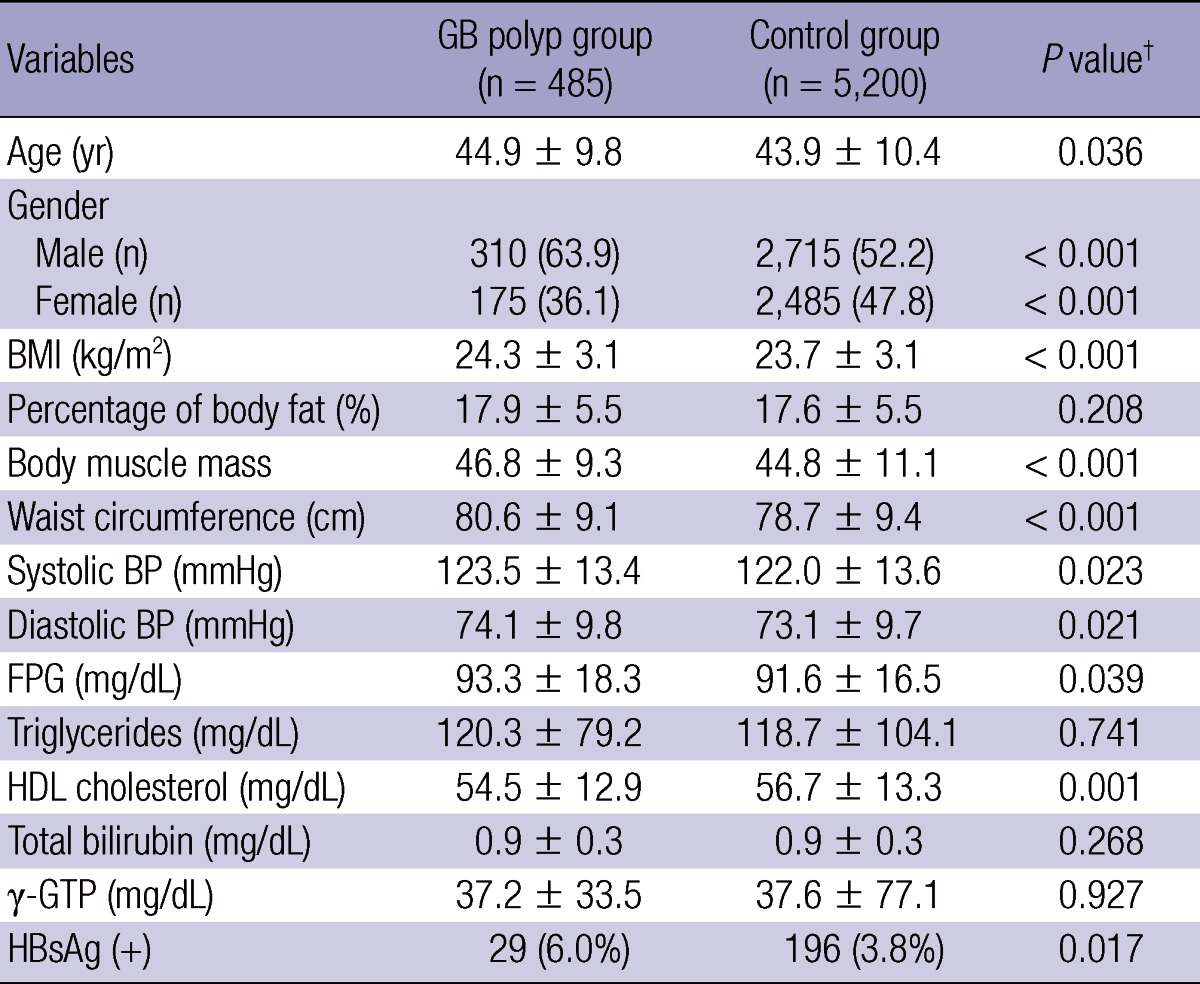
*Values (Gender and HBsAg) are presented as number (%). Other values are presented as mean ± standard error. †P values were calculated by t-test and chi-square test. BMI, body mass index; BP, blood pressure; FPG, fasting plasma glucose; HDL, high density lipoprotein.