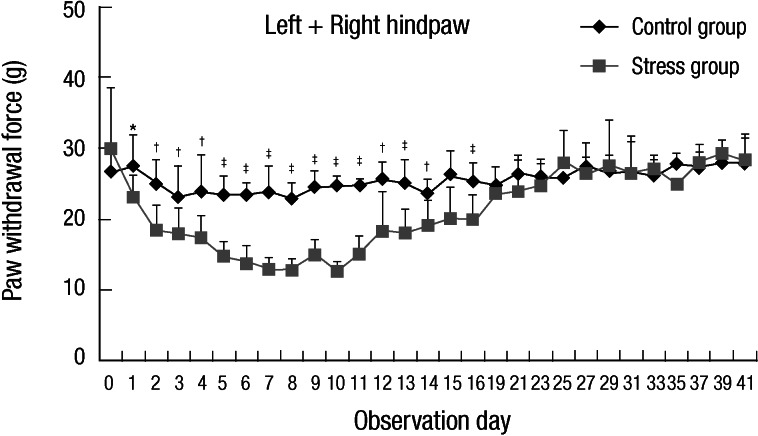
Fig. 3.
Line graph representing the median mechanical threshold from stress and control animals according to observation day. Bilateral mechanical hyper-responsiveness was recovered on day 19 (Experiment II: n = 10, group 1 and 2, respectively). Data from left and right hindpaws collapsed together for clarity of presentation. *P < 0.05, †P < 0.01, ‡P < 0.001.

