
Figure 1. Characterization of synaptic transmission and action potential-evoked presynaptic [Ca2+]i transients in DRG/SC co-culture.
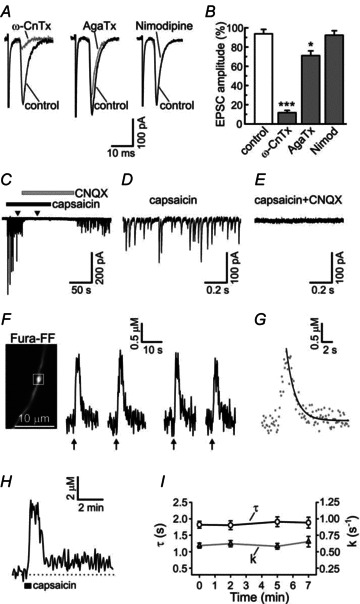
A, evoked EPSCs were recorded in DRG/SC co-culture as previously described (Medvedeva et al. 2008, 2009). The N-type voltage-gated Ca2+ channel (VGCC) inhibitor ω-conotoxin GVIA (1 μm; ω-CnTx) nearly completely abolished the EPSCs (n = 7), whereas the P/Q-type VGCC inhibitor agatoxin IVA (200 nm; AgaTx) produced a much smaller effect (n = 5). The EPSCs were not affected by the L-type VGCC inhibitor nimodipine (5 μm; n = 7). The superimposed EPSC traces represent recordings obtained before (control; black) and during the application of VGCC inhibitors (grey) for individual synaptic pairs. B, plot summarizing the effects of VGCC inhibitors (grey bars) or vehicle control (white bar) on EPSC amplitudes. To quantify the effects of VGCC inhibitors, 10 EPSC traces obtained in the presence of a given VGCC inhibitor (3 min of treatment) were averaged and normalized to the mean amplitude of the first 10 EPSC for each synaptic pair. *P < 0.05, ***P < 0.001, one-way ANOVA with Dunnett's post test (relative to control). C, capsaicin (1 μm) strongly increases the frequency of spontaneous EPSCs. This effect is reversibly inhibited by the AMPA receptor antagonist CNQX (10 μm). Enhanced glutamate release continues long after the capsaicin washout as a result of prolonged mitochondria-dependent presynaptic [Ca2+]i plateau (Medvedeva et al. 2008). D and E, two short segments of EPSC recordings from the experiment described in are shown using an expanded time scale during the treatments with capsaicin alone (D) or capsaicin combined with CNQX (E). The times corresponding to these segments are shown by arrowheads in C. F, presynaptic [Ca2+]i transients evoked by repeated trains of action potentials in capsaicin-sensitive DRG neurons. Presynaptic [Ca2+]i transients were evoked by trains of action potentials (2 s at 10 Hz for each train; arrows) applied at the time points t = 0, 2, 5 and 7 min. Image on the left shows the distribution of Fura-FF fluorescence (λex = 380 nm) in an unstimulated cell. [Ca2+]i recording was made from the axonal bouton indicated by the white box. G, the second [Ca2+]i transient from the experiment in F is shown on an expanded time scale (grey dots), and the monoexponential function obtained by fitting the recovery phase of this [Ca2+]i transient is shown by a continuous line. H, [Ca2+]i response to the TRPV1 agonist capsaicin (1 μm, 30 s), recorded from the axonal bouton in F. [Ca2+]i rapidly recovered to a new steady-state level ([Ca2+]i plateau), and remained elevated for an additional 5–15 min, as previously described (Medvedeva et al. 2008). I, summary of time constants (τ; open circles) and the rate constants (k; grey triangles) calculated for each presynaptic [Ca2+]i transient, using the same experimental protocol as in F. Data are for 27 presynaptic boutons/6 cells. Time and rate constants did not change significantly during the time course of the experiments; repeated one-way ANOVA with Bonferroni post test.